
- Home >
- Stock Photos >
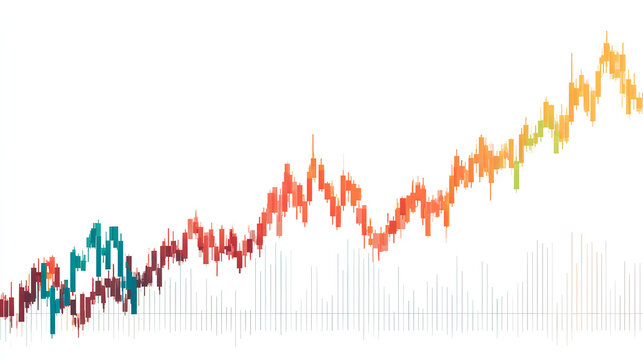
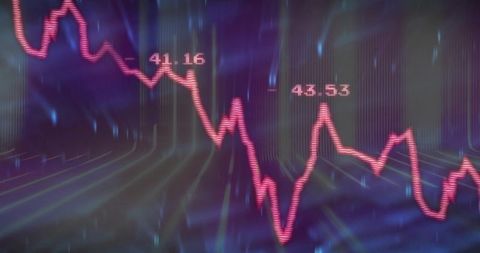
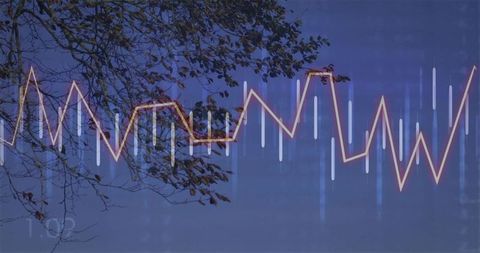
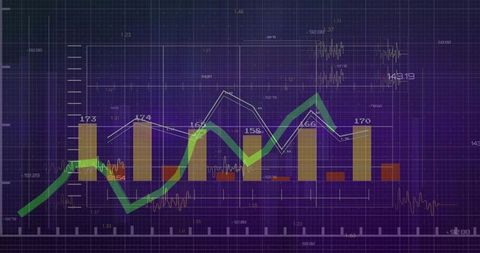
- Financial Market Data Visualization with Line Graph and Candlesticks
Financial Market Data Visualization with Line Graph and Candlesticks Image

Depicting dynamic fluctuations in financial markets, illustration combines colorful line graph trends with detailed candlestick bars. Useful for materials related to finance predictions, stock trading strategies, investment policy briefs, technology-driven data analysis applications.
Powered by 


downloads
Tags:
More
Credit Photo
If you would like to credit the Photo, here are some ways you can do so
Text Link
photo Link
<span class="text-link">
<span>
<a target="_blank" href=https://pikwizard.com/photo/financial-market-data-visualization-with-line-graph-and-candlesticks/078451fda5bd2bc0ea0c84f97dcc1708/>PikWizard</a>
</span>
</span>
<span class="image-link">
<span
style="margin: 0 0 20px 0; display: inline-block; vertical-align: middle; width: 100%;"
>
<a
target="_blank"
href="https://pikwizard.com/photo/financial-market-data-visualization-with-line-graph-and-candlesticks/078451fda5bd2bc0ea0c84f97dcc1708/"
style="text-decoration: none; font-size: 10px; margin: 0;"
>
<img src="https://pikwizard.com/pw/medium/078451fda5bd2bc0ea0c84f97dcc1708.jpg" style="margin: 0; width: 100%;" alt="" />
<p style="font-size: 12px; margin: 0;">PikWizard</p>
</a>
</span>
</span>
Free (free of charge)
Free for personal and commercial use.
Author: Awesome Content
Similar Free Stock Images

Premium


Premium


AI

Premium


Premium


Premium


AI

Premium


Premium


Premium


Premium


Premium

Premium


Premium


Premium


Premium


Premium

Premium


Premium


Premium


AI


Premium


Premium

Premium


Premium


Premium


Premium


Premium


Explore More Free Stock Images