- Home >
- Stock Photos >
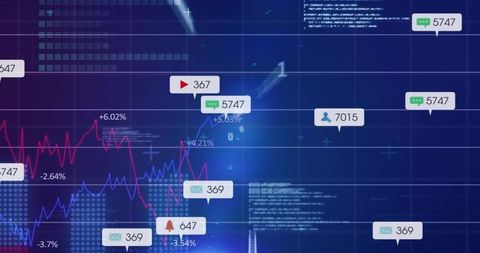
- Futuristic Data Chart with Digital Interface Elements
Futuristic Data Chart with Digital Interface Elements Image

Futuristic digital interface depicting financial growth trends and analytical charting on a blue gradient background. Ideal for illustrating concepts related to data analysis, business technology, and financial forecasting. Suitable for use in business presentations, financial reports, software applications marketing, or technology-related articles.

downloads
Tags:
More
Credit Photo
If you would like to credit the Photo, here are some ways you can do so
Text Link
photo Link
<span class="text-link">
<span>
<a target="_blank" href=https://pikwizard.com/photo/futuristic-data-chart-with-digital-interface-elements/e7795db9c119a08d9f887d09f1d3b546/>PikWizard</a>
</span>
</span>
<span class="image-link">
<span
style="margin: 0 0 20px 0; display: inline-block; vertical-align: middle; width: 100%;"
>
<a
target="_blank"
href="https://pikwizard.com/photo/futuristic-data-chart-with-digital-interface-elements/e7795db9c119a08d9f887d09f1d3b546/"
style="text-decoration: none; font-size: 10px; margin: 0;"
>
<img src="https://pikwizard.com/pw/medium/e7795db9c119a08d9f887d09f1d3b546.jpg" style="margin: 0; width: 100%;" alt="" />
<p style="font-size: 12px; margin: 0;">PikWizard</p>
</a>
</span>
</span>
Free (free of charge)
Free for personal and commercial use.
Author: Authentic Images