
- Home >
- Stock Photos >
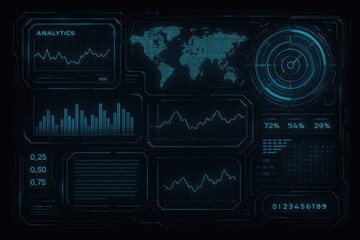
- Futuristic Data Interface with Bar and Line Graph Visualization
Futuristic Data Interface with Bar and Line Graph Visualization Image

Graphic shows advanced data interface combining bar charts, line graphs, and radar circles over digital circuit grid. Ideal for illustrating technology and data analytics-focused content such as innovative business strategies, data visualization tools, and tech-centric presentations.
Powered by 


downloads
Tags:
More
Credit Photo
If you would like to credit the Photo, here are some ways you can do so
Text Link
photo Link
<span class="text-link">
<span>
<a target="_blank" href=https://pikwizard.com/photo/futuristic-data-interface-with-bar-and-line-graph-visualization/f8ba5398743225b67909944390061907/>PikWizard</a>
</span>
</span>
<span class="image-link">
<span
style="margin: 0 0 20px 0; display: inline-block; vertical-align: middle; width: 100%;"
>
<a
target="_blank"
href="https://pikwizard.com/photo/futuristic-data-interface-with-bar-and-line-graph-visualization/f8ba5398743225b67909944390061907/"
style="text-decoration: none; font-size: 10px; margin: 0;"
>
<img src="https://pikwizard.com/pw/medium/f8ba5398743225b67909944390061907.jpg" style="margin: 0; width: 100%;" alt="" />
<p style="font-size: 12px; margin: 0;">PikWizard</p>
</a>
</span>
</span>
Free (free of charge)
Free for personal and commercial use.
Author: People Creations
Similar Free Stock Images

Premium


Premium

Premium


Premium


Premium


Premium


Premium


Premium

Premium

Premium


Premium


Premium


Premium


Premium


Premium

Premium


Premium


Premium


Premium


Premium


Premium


Premium


Premium

Premium


Premium


Explore More Free Stock Images