
- Home >
- Free Stock Photos & Images >
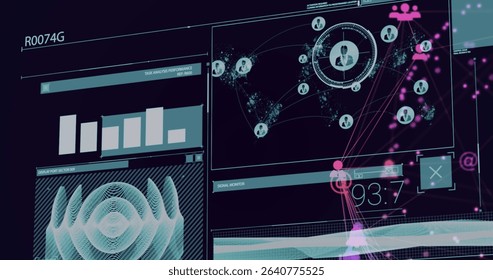
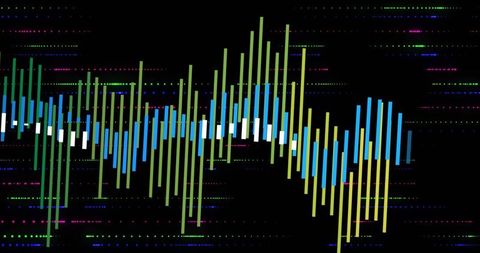
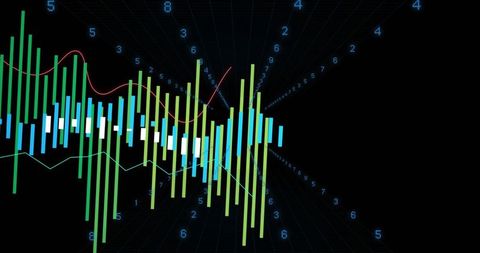
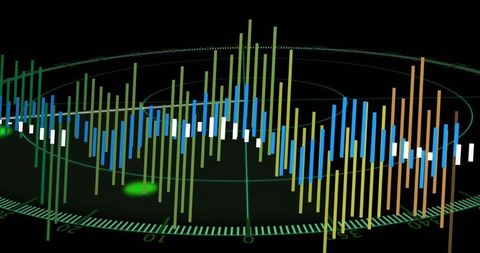
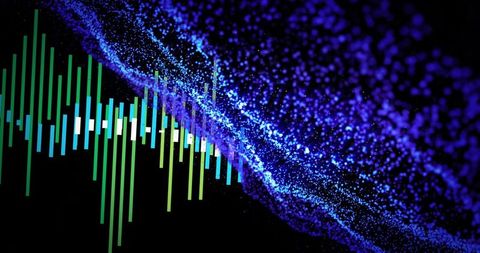
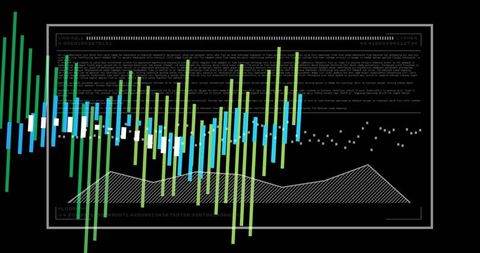
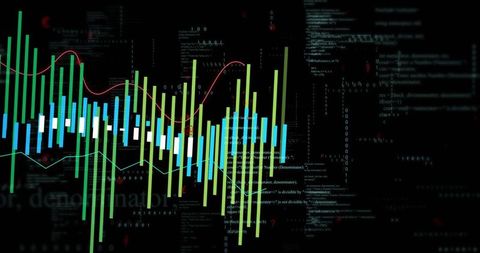
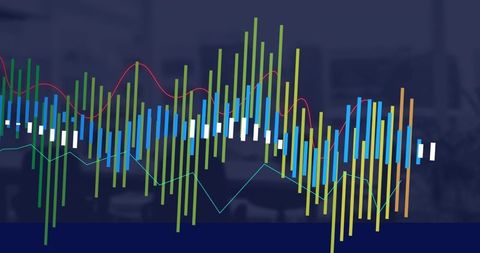
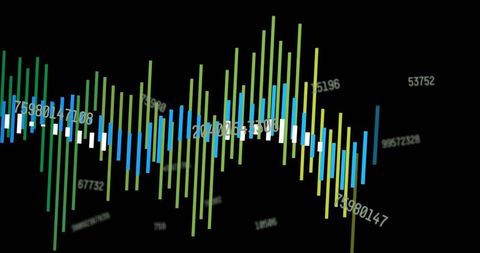
- Futuristic Data Waveform Visualizing Real-Time Analytics with Neon Vertical Bars
Futuristic Data Waveform Visualizing Real-Time Analytics with Neon Vertical Bars Free Stock Image

Abstract neon waveform showing vertical bars and rectangular blocks over dotted digital grid, visualizing fluctuating metrics and real-time data streams. Bright green and blue bars creating depth and motion against dark backdrop, evoking futuristic technology and high-tech dashboard aesthetics. Suiting fintech presentations, data analytics articles, technology websites, UI mockups, marketing campaigns, and broadcast graphics. Working well as hero header, background for investor reports, slide art for conference talks, or asset for social media ads promoting analytics tools. Offering ample space for overlaying logos, headlines, data labels, and interactive controls.
Powered by  - Get 15% off with code: PIKWIZARD15


downloads
Tags:
More
Credit Photo
If you would like to credit the Photo, here are some ways you can do so
Text Link
photo Link
<span class="text-link">
<span>
<a target="_blank" href=https://pikwizard.com/photo/futuristic-data-waveform-visualizing-real-time-analytics-with-neon-vertical-bars/a8a6b2ee3eaad0a74ca1801e32de6a72/>PikWizard</a>
</span>
</span>
<span class="image-link">
<span
style="margin: 0 0 20px 0; display: inline-block; vertical-align: middle; width: 100%;"
>
<a
target="_blank"
href="https://pikwizard.com/photo/futuristic-data-waveform-visualizing-real-time-analytics-with-neon-vertical-bars/a8a6b2ee3eaad0a74ca1801e32de6a72/"
style="text-decoration: none; font-size: 10px; margin: 0;"
>
<img src="https://thumbs.wbm.im/pw/medium/a8a6b2ee3eaad0a74ca1801e32de6a72.jpg" style="margin: 0; width: 100%;" alt="Futuristic Data Waveform Visualizing Real-Time Analytics with Neon Vertical Bars" />
<p style="font-size: 12px; margin: 0;">PikWizard</p>
</a>
</span>
</span>
Free (free of charge)
Free for personal and commercial use.
Author: People Creations
Similar Free Stock Images


Premium


Premium


Premium


Premium


Premium


Premium


Premium


Premium


Premium


Premium


Premium


Premium


Premium


Premium


Premium


Premium


Premium


Premium


Premium


Premium


Premium


Premium


Premium


Premium


Premium

Explore More Free Stock Images