
- Home >
- Stock Photos >
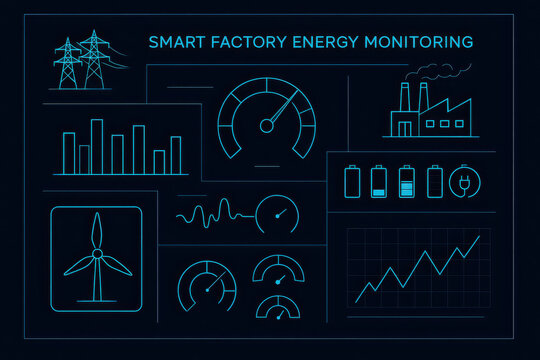
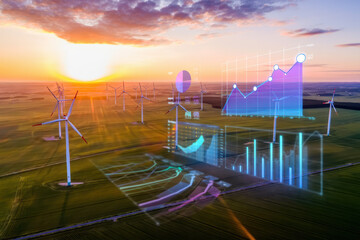
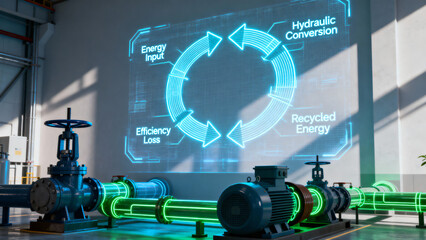
- Futuristic Energy Analytics Interface with Sustainability Icons
Futuristic Energy Analytics Interface with Sustainability Icons Image

Illustrating a dynamic analytics dashboard with bright graphs and visible sustainability icons like wind turbine and CO?, highlighting a cutting-edge renewable energy computational environment. This is ideal for content promoting green technology solutions, digital data platforms, environmental analysis reports, and education material asserting advanced energy monitoring.
Powered by 


downloads
Tags:
More
Credit Photo
If you would like to credit the Photo, here are some ways you can do so
Text Link
photo Link
<span class="text-link">
<span>
<a target="_blank" href=https://pikwizard.com/photo/futuristic-energy-analytics-interface-with-sustainability-icons/fe00a6c03cd189cdb028dec93e1c7b4f/>PikWizard</a>
</span>
</span>
<span class="image-link">
<span
style="margin: 0 0 20px 0; display: inline-block; vertical-align: middle; width: 100%;"
>
<a
target="_blank"
href="https://pikwizard.com/photo/futuristic-energy-analytics-interface-with-sustainability-icons/fe00a6c03cd189cdb028dec93e1c7b4f/"
style="text-decoration: none; font-size: 10px; margin: 0;"
>
<img src="https://pikwizard.com/pw/medium/fe00a6c03cd189cdb028dec93e1c7b4f.jpg" style="margin: 0; width: 100%;" alt="" />
<p style="font-size: 12px; margin: 0;">PikWizard</p>
</a>
</span>
</span>
Free (free of charge)
Free for personal and commercial use.
Author: Authentic Images
Similar Free Stock Images

Premium


Premium

Premium


Premium


Premium


Premium


Premium


Premium


Premium


Premium


Premium


Premium


Premium

Premium

Premium


Premium


Premium


Premium
Premium

Premium


Premium


Premium


Premium


Premium

Premium


Explore More Free Stock Images