- Home >
- Stock Photos >
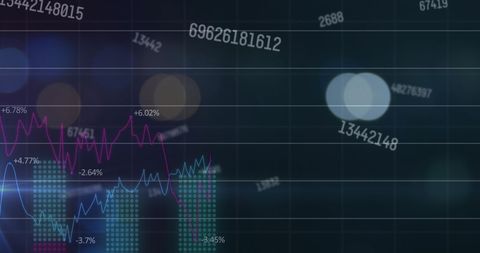
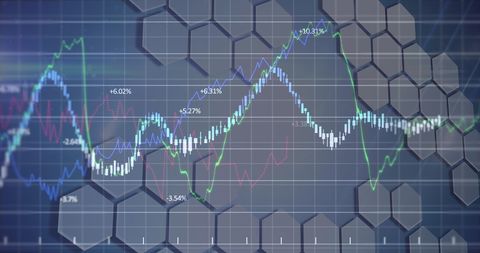
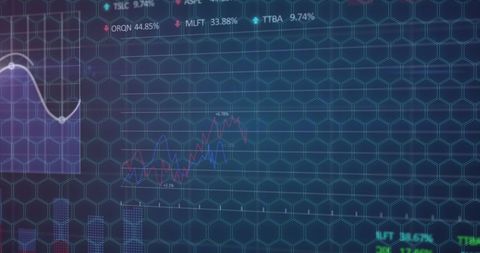
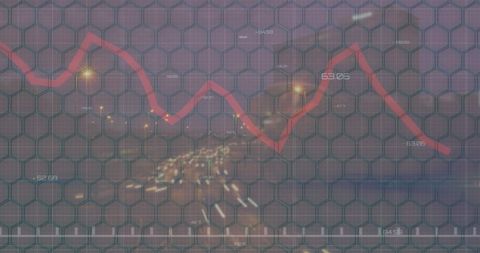
- Futuristic Technology Interface with Chart Visualizations
Futuristic Technology Interface with Chart Visualizations Image
This dynamic visualization features digital charts on a blue background, conveying data analysis and technological innovation. It incorporates elements of a futuristic interface. Ideal for representing high-tech concepts, digital strategy, financial analysis, and technological advancements in business presentations or technology blogs.

downloads
Tags:
More
Credit Photo
If you would like to credit the Photo, here are some ways you can do so
Text Link
photo Link
<span class="text-link">
<span>
<a target="_blank" href=https://pikwizard.com/photo/futuristic-technology-interface-with-chart-visualizations/8619aa638d3aac482b67f919c963c8e5/>PikWizard</a>
</span>
</span>
<span class="image-link">
<span
style="margin: 0 0 20px 0; display: inline-block; vertical-align: middle; width: 100%;"
>
<a
target="_blank"
href="https://pikwizard.com/photo/futuristic-technology-interface-with-chart-visualizations/8619aa638d3aac482b67f919c963c8e5/"
style="text-decoration: none; font-size: 10px; margin: 0;"
>
<img src="https://pikwizard.com/pw/medium/8619aa638d3aac482b67f919c963c8e5.jpg" style="margin: 0; width: 100%;" alt="" />
<p style="font-size: 12px; margin: 0;">PikWizard</p>
</a>
</span>
</span>
Free (free of charge)
Free for personal and commercial use.
Author: Creative Art