
- Home >
- Free Stock Photos & Images >
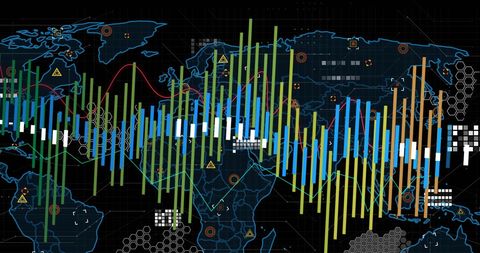
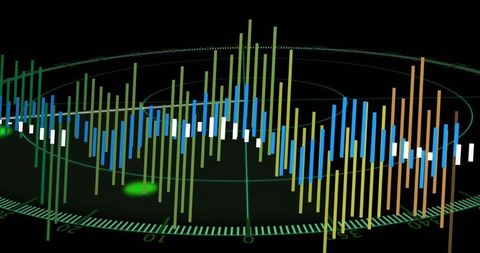
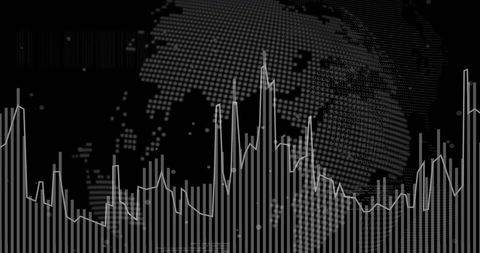
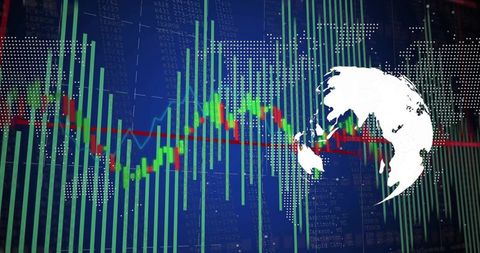
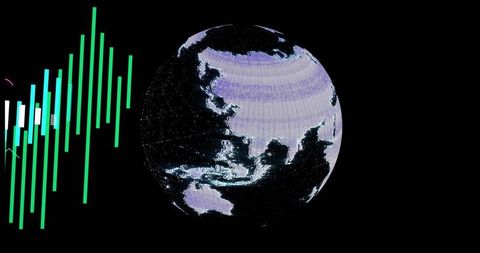
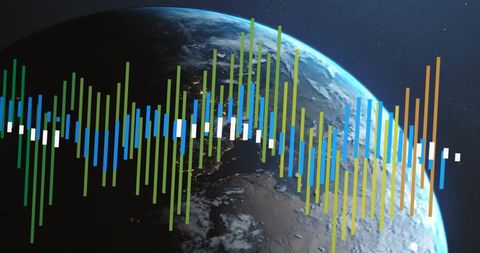
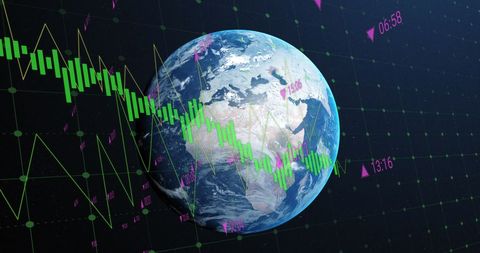
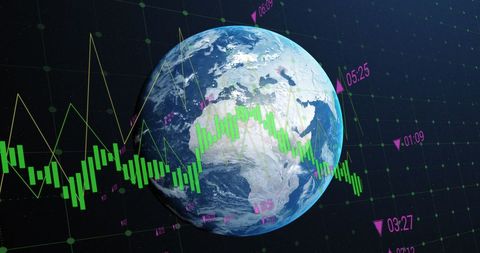
- Globe glowing with neon data bars and waveforms visualizing global analytics, futuristic dashboard
Globe glowing with neon data bars and waveforms visualizing global analytics, futuristic dashboard Free Stock Image
Dark pixelated globe glowing at right with neon green and cyan vertical data bars and red and teal waveforms crossing left, creating futuristic data dashboard aesthetic. Graphic showing global analytics, market trends, network traffic, or environmental monitoring. Use for technology presentations, financial reports, website hero banners, app interfaces, marketing campaigns, and news articles about data science or cyber security. Provide high-contrast backdrop for overlaying headlines, icons, or charts. Color palette and composition suiting tech brands, fintech startups, research teams, and editorial layouts needing modern, high-tech visuals.
Powered by  - Get 15% off with code: PIKWIZARD15


downloads
Tags:
More
Credit Photo
If you would like to credit the Photo, here are some ways you can do so
Text Link
photo Link
<span class="text-link">
<span>
<a target="_blank" href=https://pikwizard.com/photo/globe-glowing-with-neon-data-bars-and-waveforms-visualizing-global-analytics-futuristic-dashboard/d242e05f502796147339f1e1ec93e968/>PikWizard</a>
</span>
</span>
<span class="image-link">
<span
style="margin: 0 0 20px 0; display: inline-block; vertical-align: middle; width: 100%;"
>
<a
target="_blank"
href="https://pikwizard.com/photo/globe-glowing-with-neon-data-bars-and-waveforms-visualizing-global-analytics-futuristic-dashboard/d242e05f502796147339f1e1ec93e968/"
style="text-decoration: none; font-size: 10px; margin: 0;"
>
<img src="https://thumbs.wbm.im/pw/medium/d242e05f502796147339f1e1ec93e968.jpg" style="margin: 0; width: 100%;" alt="Globe glowing with neon data bars and waveforms visualizing global analytics, futuristic dashboard" />
<p style="font-size: 12px; margin: 0;">PikWizard</p>
</a>
</span>
</span>
Free (free of charge)
Free for personal and commercial use.
Author: Creative Art
Similar Free Stock Images


Premium

Premium


Premium


Premium


Premium


Premium


Premium


Premium


Premium


Premium


Premium


Premium


Premium


Premium


Premium


Premium


Premium


Premium


Premium


Premium


Premium


Premium


Premium


Premium


Premium

Explore More Free Stock Images