
- Home >
- Stock Photos >
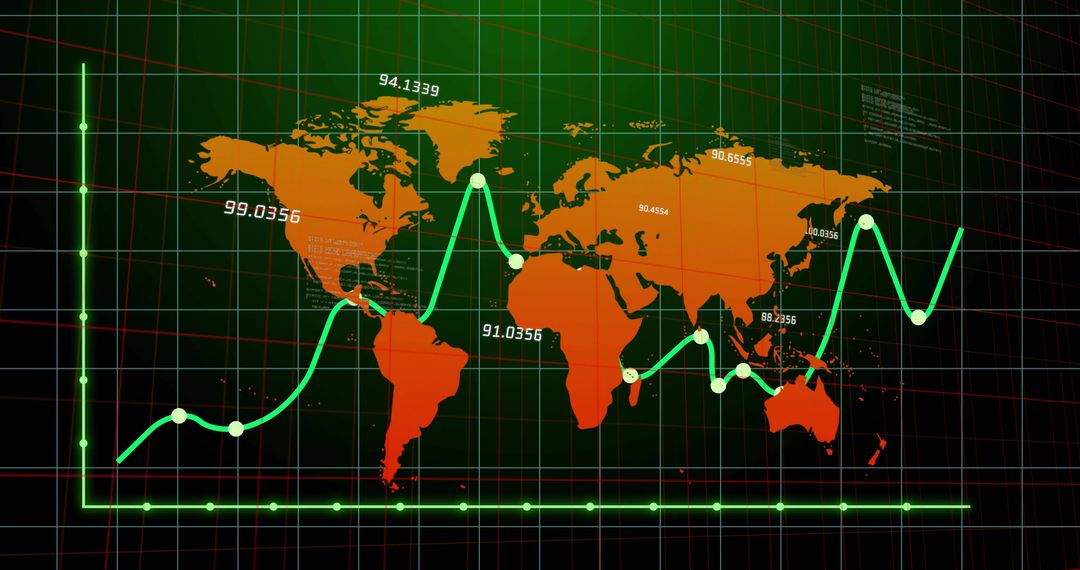
- Glowing Neon Red Global Trend Line Chart Showing Market Fluctuations on Digital World Map
Glowing Neon Red Global Trend Line Chart Showing Market Fluctuations on Digital World Map Image

Bright neon-red zigzag trend line crossing dotted world map grid, conveying global market volatility and upward momentum. High-contrast green grid and dotted continents creating futuristic digital dashboard look, suitable for finance and tech themes. Ideal for illustrating market trends, economic forecasts, investment reports, business presentations, and analytics dashboards. Working well as website hero, slide background, report cover, blog header, social media graphic, or marketing campaign visual. Including space in upper right for overlaying headline or logo, and compatible with color grading and text overlays for branded materials.
Powered by  - Get 15% off with code: PIKWIZARD15


0
downloads
downloads
Tags:
More
Credit Photo
If you would like to credit the Photo, here are some ways you can do so
Text Link
photo Link
<span class="text-link">
<span>
<a target="_blank" href=https://pikwizard.com/photo/glowing-neon-red-global-trend-line-chart-showing-market-fluctuations-on-digital-world-map/196b2fe794d8575b4e3c377711c9d3dc/>PikWizard</a>
</span>
</span>
<span class="image-link">
<span
style="margin: 0 0 20px 0; display: inline-block; vertical-align: middle; width: 100%;"
>
<a
target="_blank"
href="https://pikwizard.com/photo/glowing-neon-red-global-trend-line-chart-showing-market-fluctuations-on-digital-world-map/196b2fe794d8575b4e3c377711c9d3dc/"
style="text-decoration: none; font-size: 10px; margin: 0;"
>
<img src="https://pikwizard.com/pw/medium/196b2fe794d8575b4e3c377711c9d3dc.jpg" style="margin: 0; width: 100%;" alt="" />
<p style="font-size: 12px; margin: 0;">PikWizard</p>
</a>
</span>
</span>
Free (free of charge)
Free for personal and commercial use.
Author: Creative Art
Similar Free Stock Images

Premium


Premium


Premium


Premium


Premium


Premium


Premium


Premium


Premium


Premium


Premium


Premium


Premium


Premium


Premium


Premium


Premium


Premium


Premium


Premium


Premium


Premium


Premium


Premium

