- Home >
- Stock Photos >
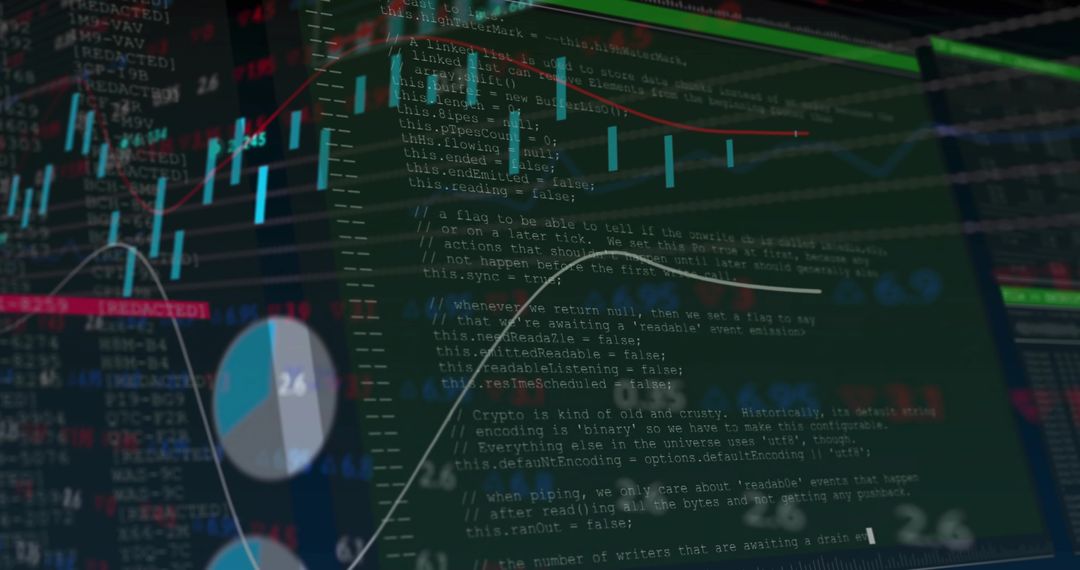
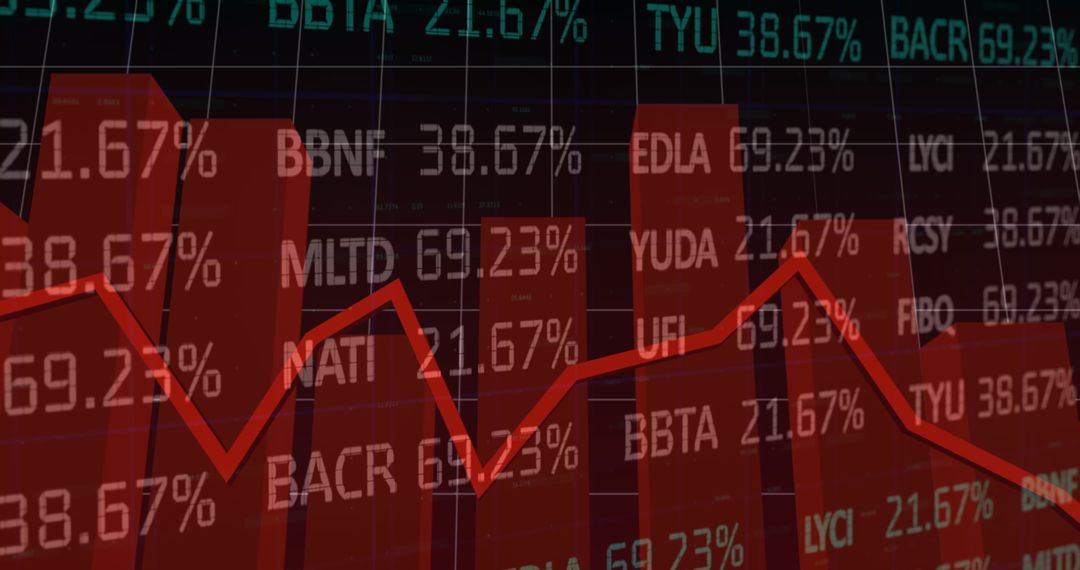
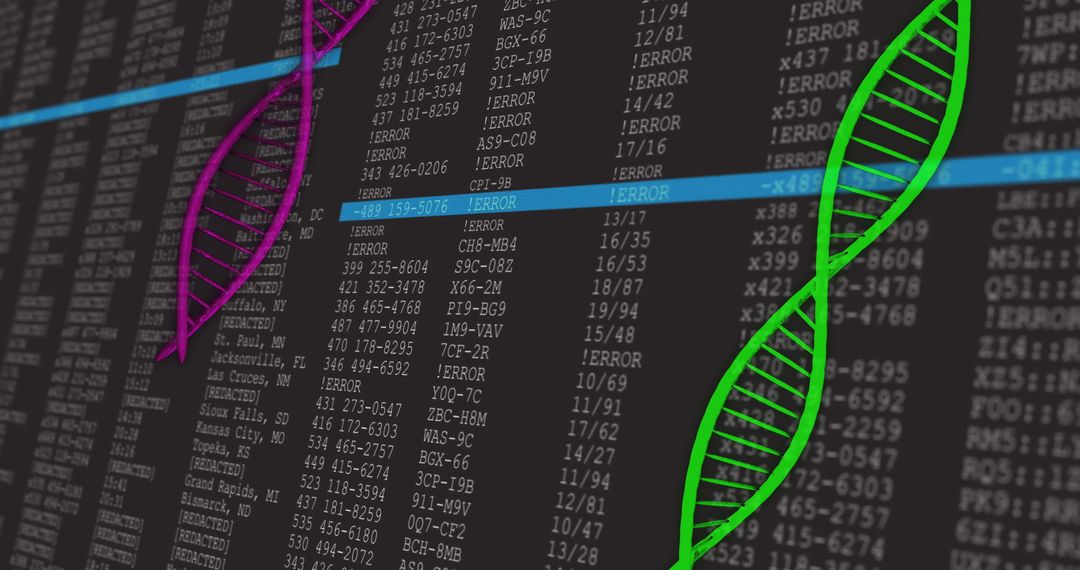
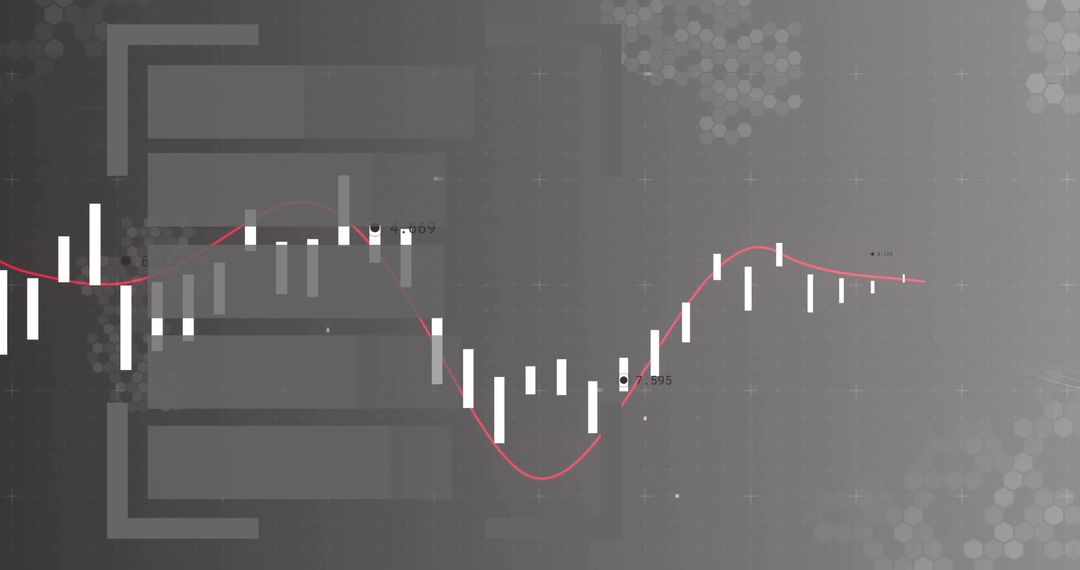
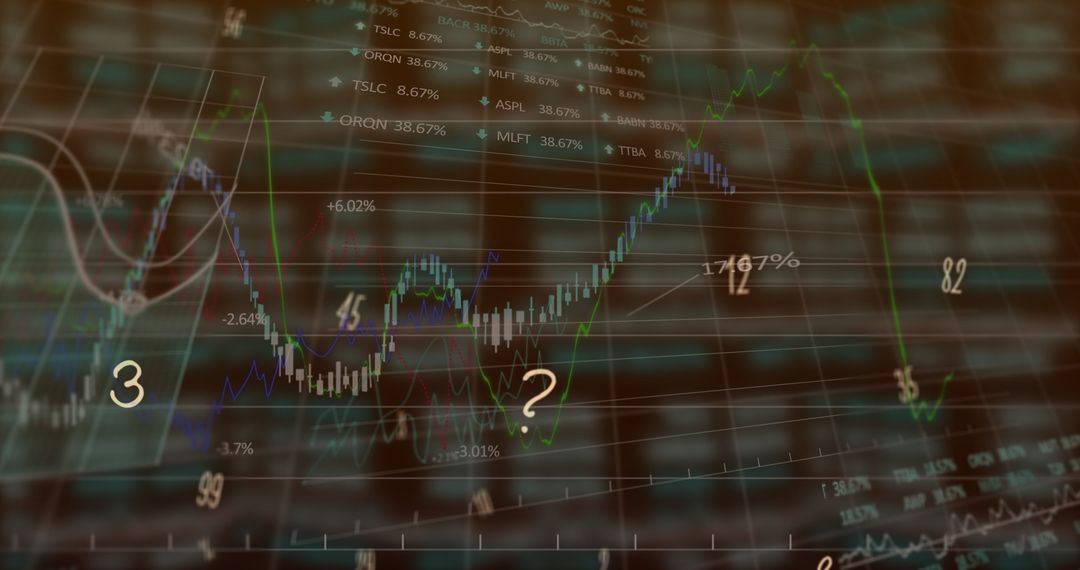
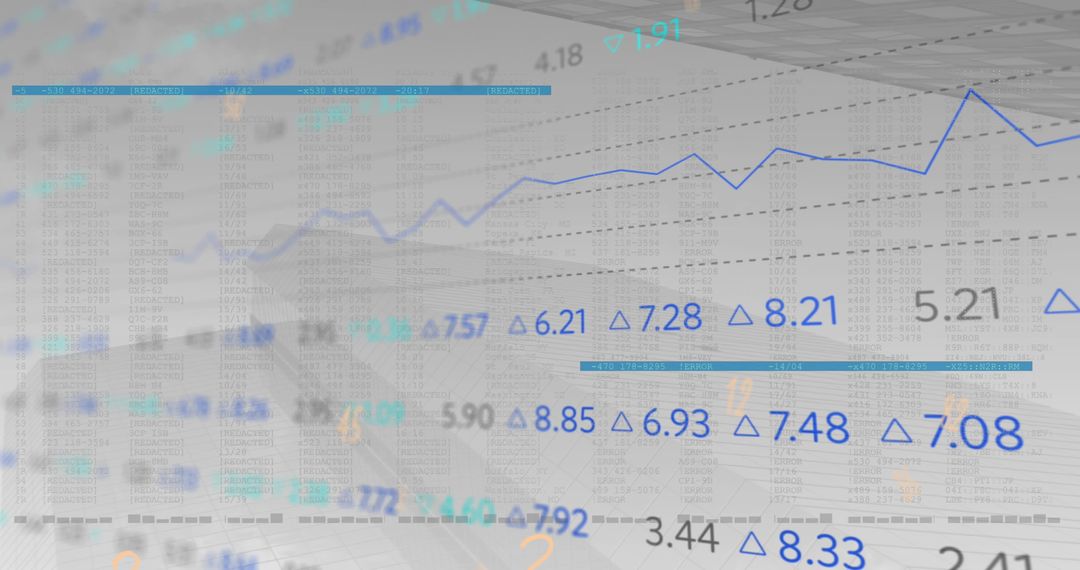
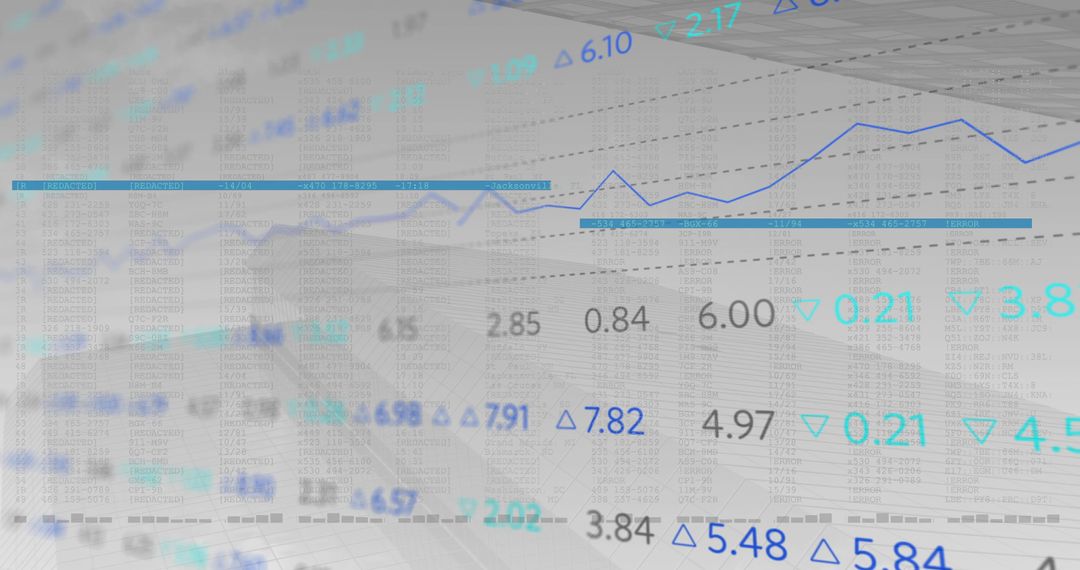
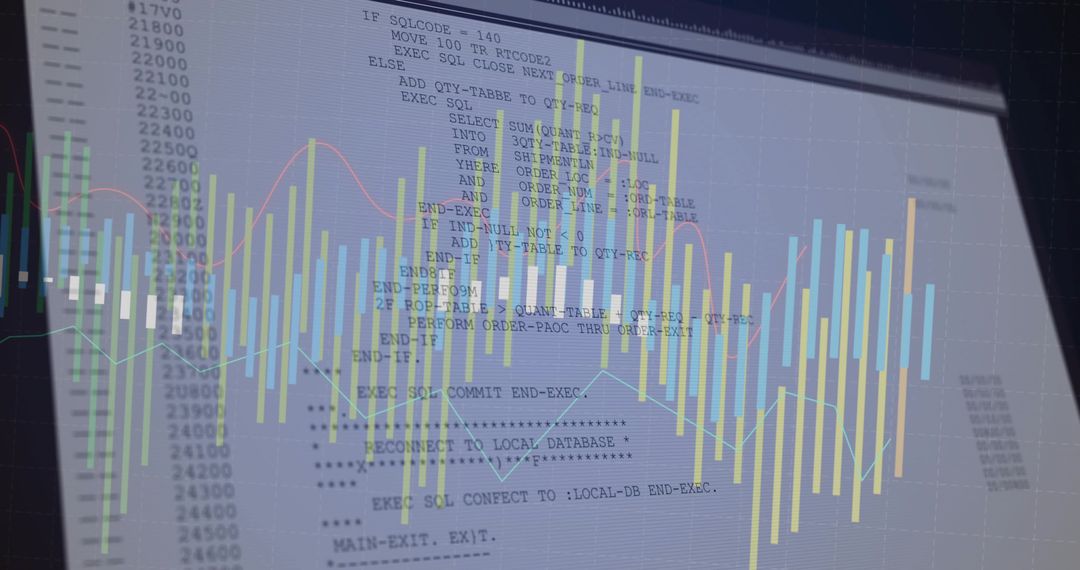
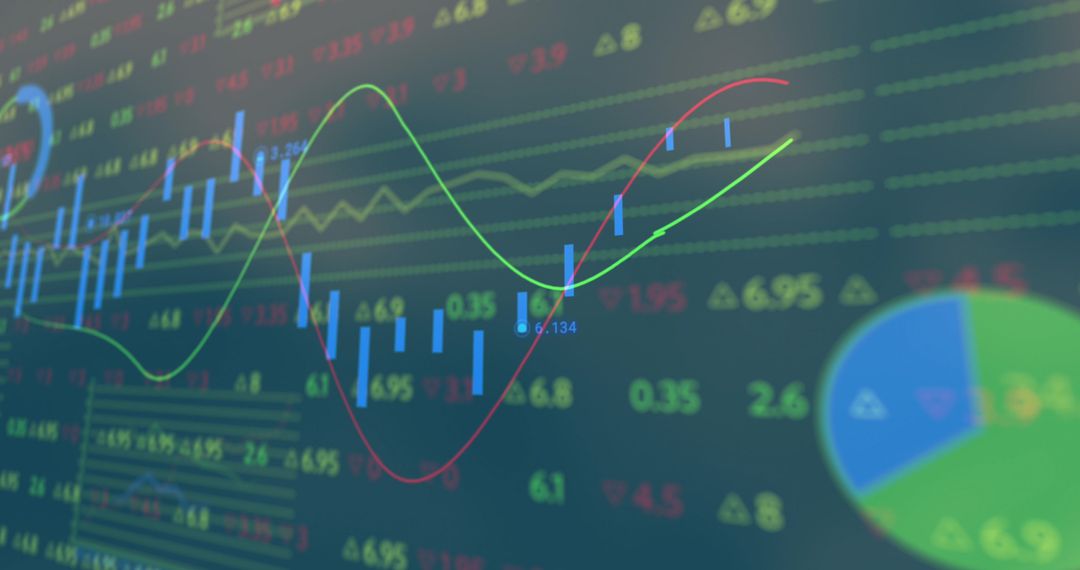
- Grayscale Trading Dashboard Showing Candlestick Chart with Red Trend Line and Error Codes
Grayscale Trading Dashboard Showing Candlestick Chart with Red Trend Line and Error Codes Image

Showing candlestick chart with red trend line over grayscale data matrix and ERROR code overlay. Conveying market volatility, technical analysis, system failure, and cybersecurity risk. Supporting fintech branding, trading platform UI, market report, blog post, investor presentation. Working well as hero graphic for trading platform landing page, background for webinar slides, header for market analysis article, visual for risk management report. Allowing easy cropping for banner, poster, social media formats. Offering high contrast and minimal color palette for clear text overlay and brand color integration.
Powered by  - Get 15% off with code: PIKWIZARD15


0
downloads
downloads
Tags:
More
Credit Photo
If you would like to credit the Photo, here are some ways you can do so
Text Link
photo Link
<span class="text-link">
<span>
<a target="_blank" href=https://pikwizard.com/photo/grayscale-trading-dashboard-showing-candlestick-chart-with-red-trend-line-and-error-codes/217371e6260384e7b420108674dfa5fe/>PikWizard</a>
</span>
</span>
<span class="image-link">
<span
style="margin: 0 0 20px 0; display: inline-block; vertical-align: middle; width: 100%;"
>
<a
target="_blank"
href="https://pikwizard.com/photo/grayscale-trading-dashboard-showing-candlestick-chart-with-red-trend-line-and-error-codes/217371e6260384e7b420108674dfa5fe/"
style="text-decoration: none; font-size: 10px; margin: 0;"
>
<img src="https://pikwizard.com/pw/medium/217371e6260384e7b420108674dfa5fe.jpg" style="margin: 0; width: 100%;" alt="" />
<p style="font-size: 12px; margin: 0;">PikWizard</p>
</a>
</span>
</span>
Free (free of charge)
Free for personal and commercial use.
Author: Awesome Content
Similar Free Stock Images

Premium


Premium


Premium


Premium


Premium


Premium


Premium


Premium


Premium


Premium


Premium


Premium


Premium


Premium


Premium


Premium


Premium


Premium


Premium


Premium


Premium


Premium


Premium


Premium