
- Home >
- Stock Photos >
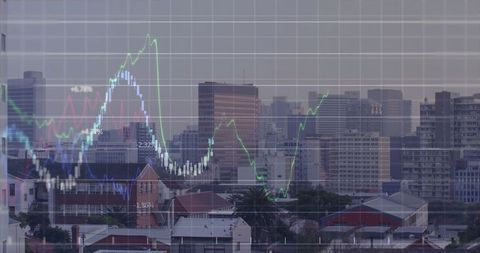
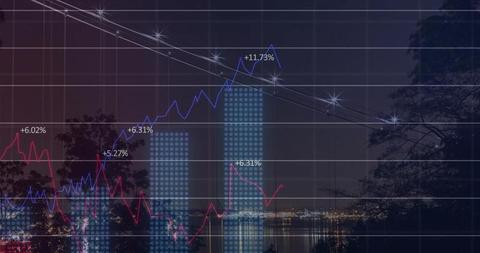
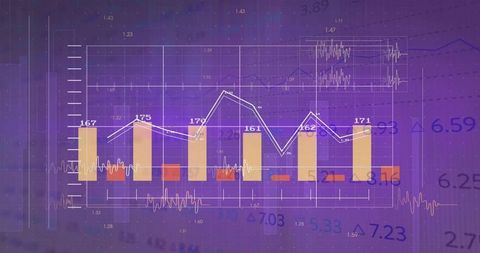
- Innovative Data Visualization on Urban Skyline Background
Innovative Data Visualization on Urban Skyline Background Image

Graph depiction and bar chart converge on a financial theme with metropolitan backdrop, blending modern technology with data analytics. Useful for illustrating economic reports, financial trends, data analysis presentations, or business case studies where infographics intersect with city life narratives.
Powered by 


downloads
Tags:
More
Credit Photo
If you would like to credit the Photo, here are some ways you can do so
Text Link
photo Link
<span class="text-link">
<span>
<a target="_blank" href=https://pikwizard.com/photo/innovative-data-visualization-on-urban-skyline-background/d20c696b4c99b9dba5184fec8e97cd21/>PikWizard</a>
</span>
</span>
<span class="image-link">
<span
style="margin: 0 0 20px 0; display: inline-block; vertical-align: middle; width: 100%;"
>
<a
target="_blank"
href="https://pikwizard.com/photo/innovative-data-visualization-on-urban-skyline-background/d20c696b4c99b9dba5184fec8e97cd21/"
style="text-decoration: none; font-size: 10px; margin: 0;"
>
<img src="https://pikwizard.com/pw/medium/d20c696b4c99b9dba5184fec8e97cd21.jpg" style="margin: 0; width: 100%;" alt="" />
<p style="font-size: 12px; margin: 0;">PikWizard</p>
</a>
</span>
</span>
Free (free of charge)
Free for personal and commercial use.
Author: Creative Art
Similar Free Stock Images
Premium


Premium


Premium


Premium


Premium


Premium


Premium


Premium


Premium

Premium


Premium


Premium


Premium


Premium


Premium


Premium


Premium


Premium


Premium


Premium


Premium


Premium


Premium


Premium

Premium


Explore More Free Stock Images