
- Home >
- Free Stock Photos & Images >
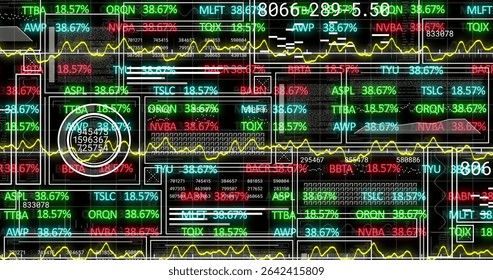
- Multicolor data visualization with sinusoidal waveform, trend lines and analytics dashboard grid
Multicolor data visualization with sinusoidal waveform, trend lines and analytics dashboard grid Free Stock Image

Showing multicolor trend lines and layered peak curves over dark blue grid, featuring cyan sinusoidal waveform and numeric annotation 9182 plus formula Vm=R*t. Connoting data analysis, signal processing, forecasting, and performance monitoring with modern neon accents. Featuring clean grid lines and high contrast for tech oriented aesthetic. Working well for hero banners, pitch decks, BI dashboards, financial reports, website headers, social media posts, and editorial illustration. Pairing with financial copy, UX mockups, or video backgrounds to emphasize analytics, trends, or real-time monitoring. Providing ample negative space for overlaying text, icons, or data labels and enabling easy color adjustments for brand alignment.
Powered by  - Get 15% off with code: PIKWIZARD15


downloads
Tags:
More
Credit Photo
If you would like to credit the Photo, here are some ways you can do so
Text Link
photo Link
<span class="text-link">
<span>
<a target="_blank" href=https://pikwizard.com/photo/multicolor-data-visualization-with-sinusoidal-waveform-trend-lines-and-analytics-dashboard-grid/5fb3c138793001bf4723ff2bacafc583/>PikWizard</a>
</span>
</span>
<span class="image-link">
<span
style="margin: 0 0 20px 0; display: inline-block; vertical-align: middle; width: 100%;"
>
<a
target="_blank"
href="https://pikwizard.com/photo/multicolor-data-visualization-with-sinusoidal-waveform-trend-lines-and-analytics-dashboard-grid/5fb3c138793001bf4723ff2bacafc583/"
style="text-decoration: none; font-size: 10px; margin: 0;"
>
<img src="https://thumbs.wbm.im/pw/medium/5fb3c138793001bf4723ff2bacafc583.jpg" style="margin: 0; width: 100%;" alt="Multicolor data visualization with sinusoidal waveform, trend lines and analytics dashboard grid" />
<p style="font-size: 12px; margin: 0;">PikWizard</p>
</a>
</span>
</span>
Free (free of charge)
Free for personal and commercial use.
Author: Authentic Images
Similar Free Stock Images


Premium


AI


Premium


Premium


Premium


Premium


Premium


Premium


Premium


Premium


Premium


Premium


Premium


Premium


Premium


Premium


Premium


Premium


AI


Premium


Premium


Premium


Premium


Premium


AI

Premium


Premium


Premium

Explore More Free Stock Images