- Home >
- Stock Photos >
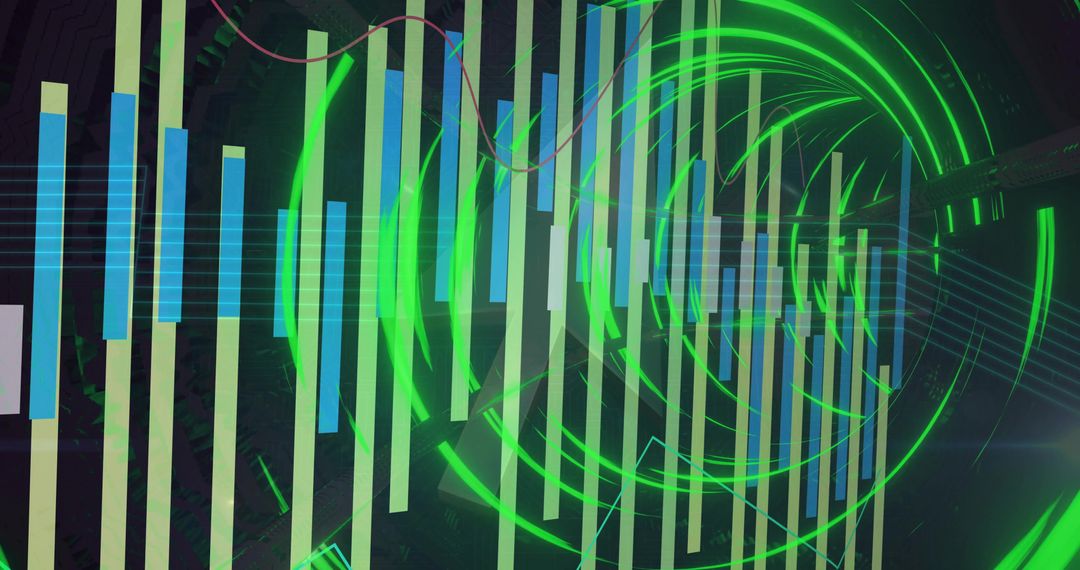
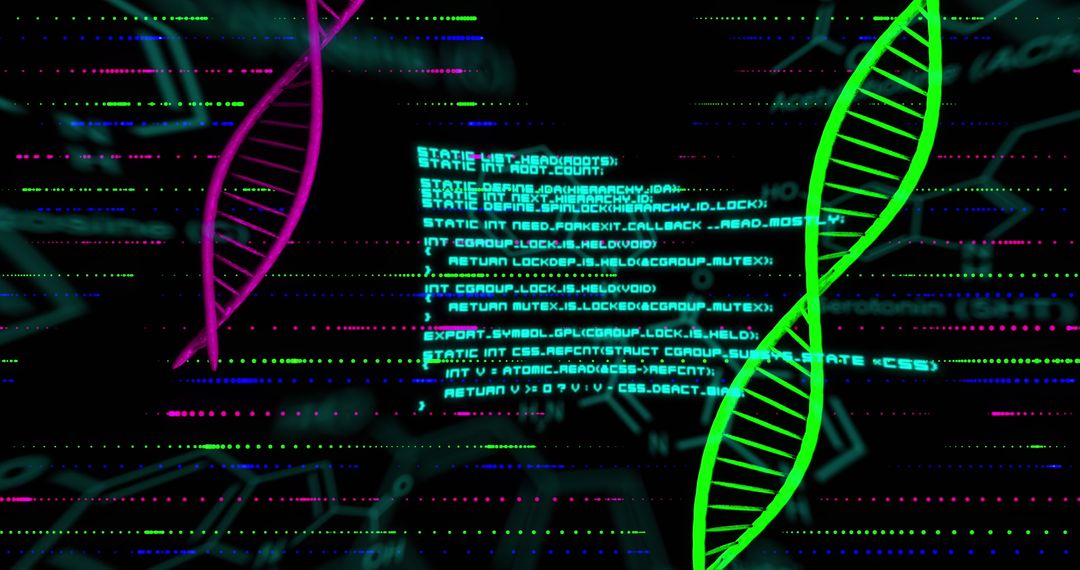
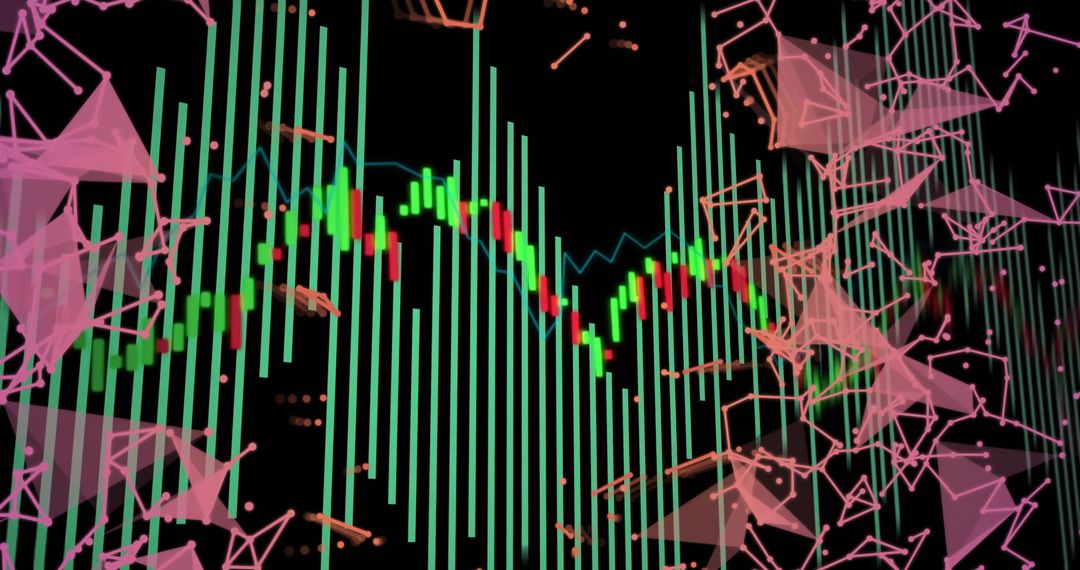
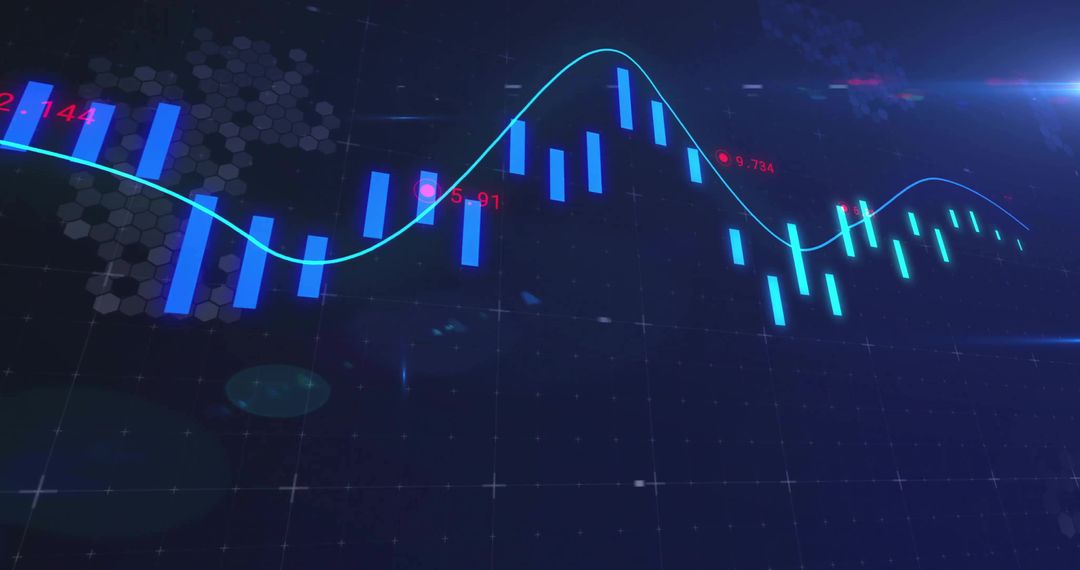
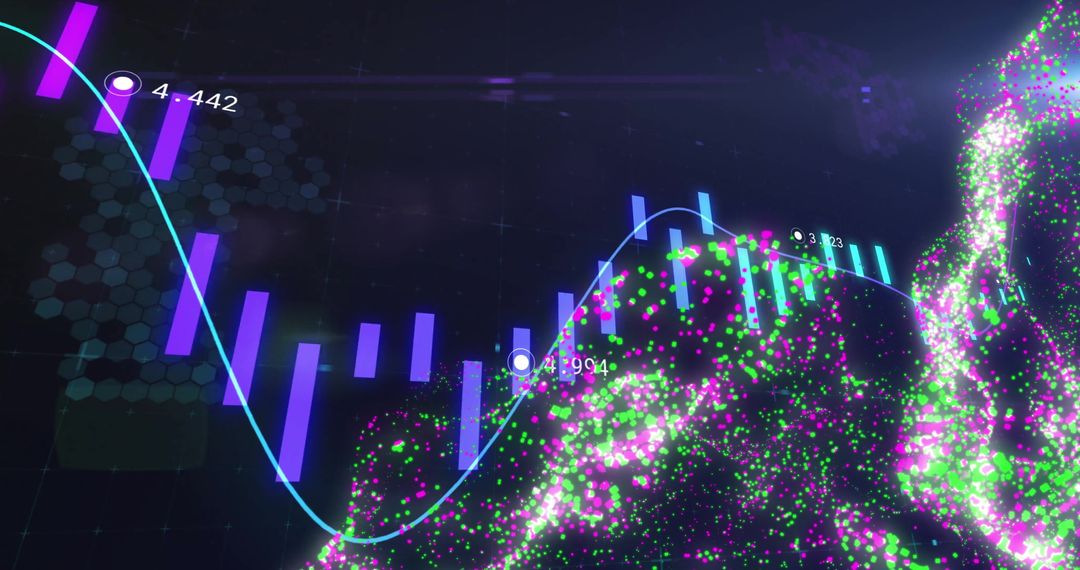
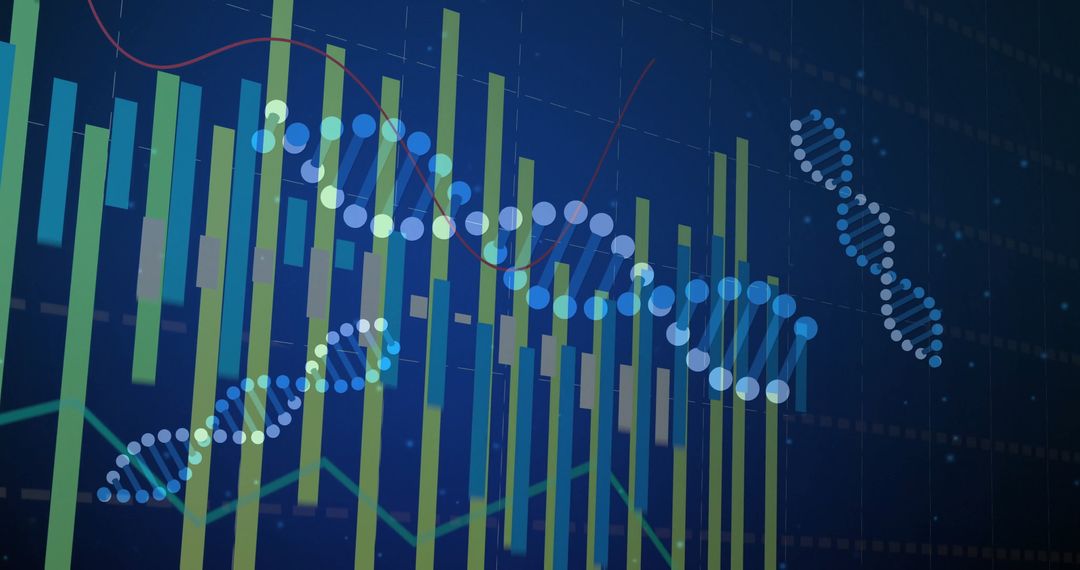
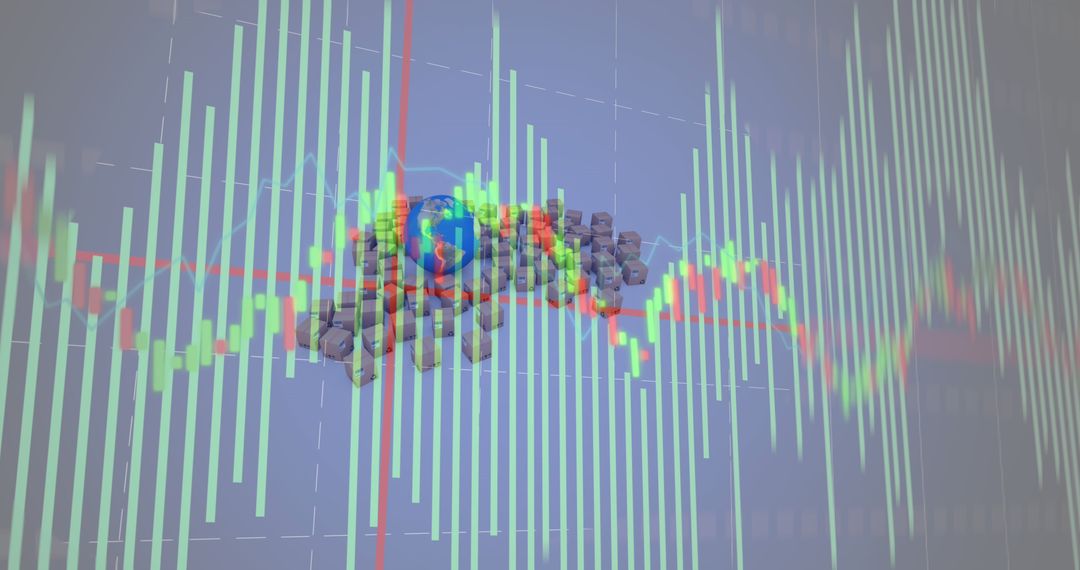
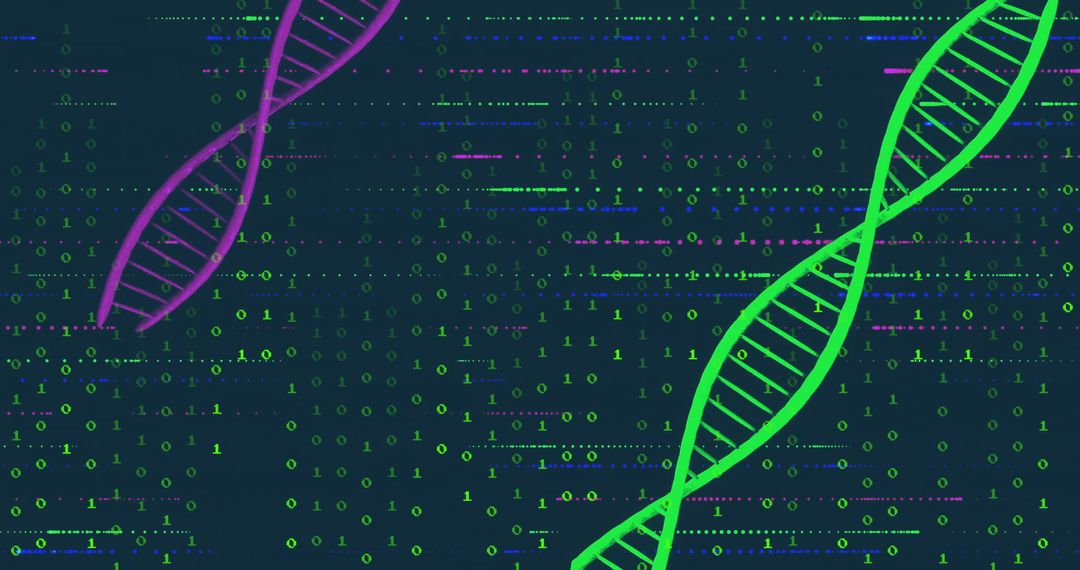
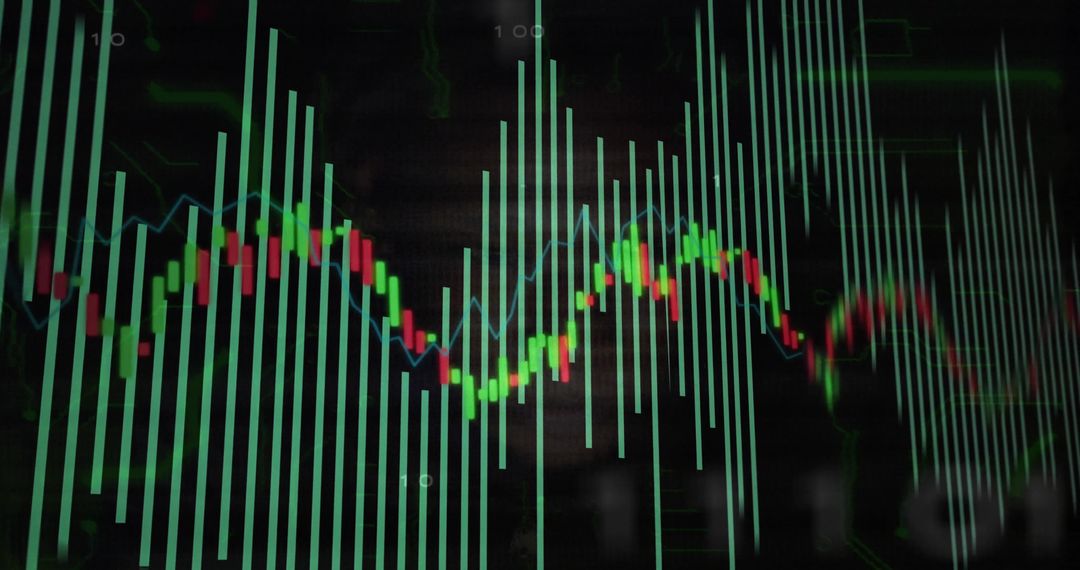
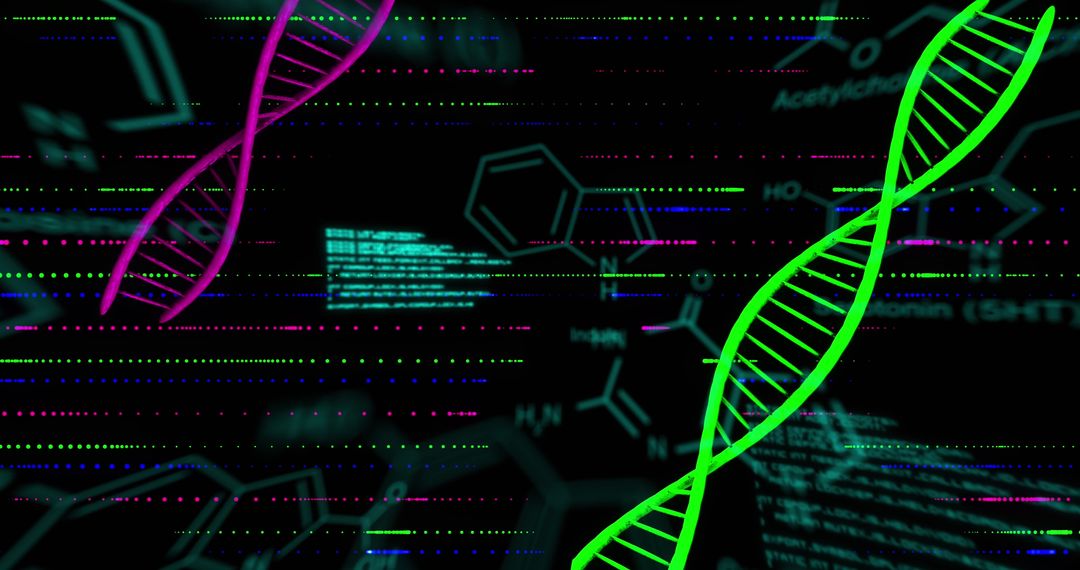
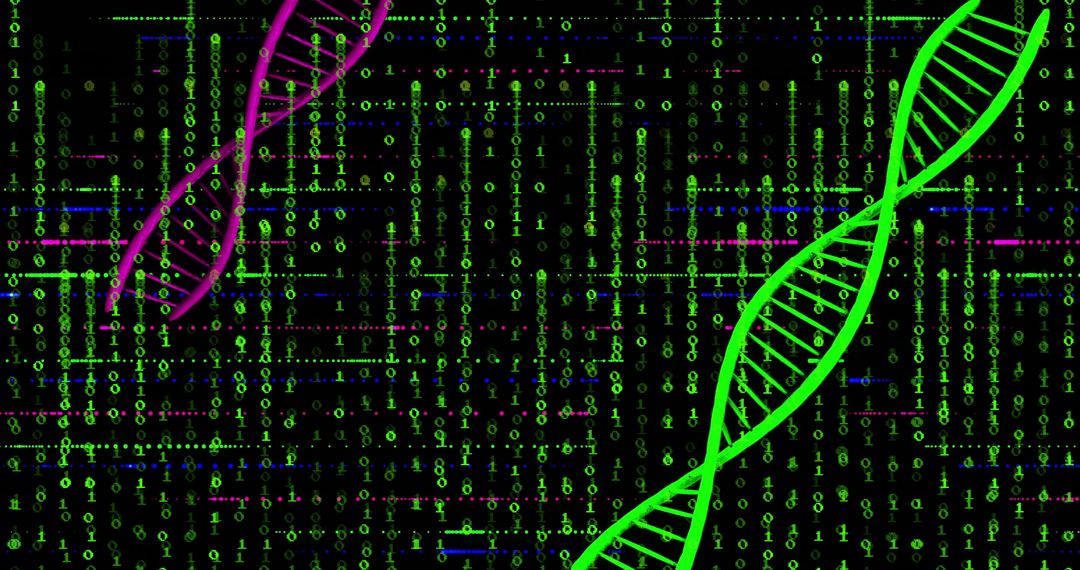
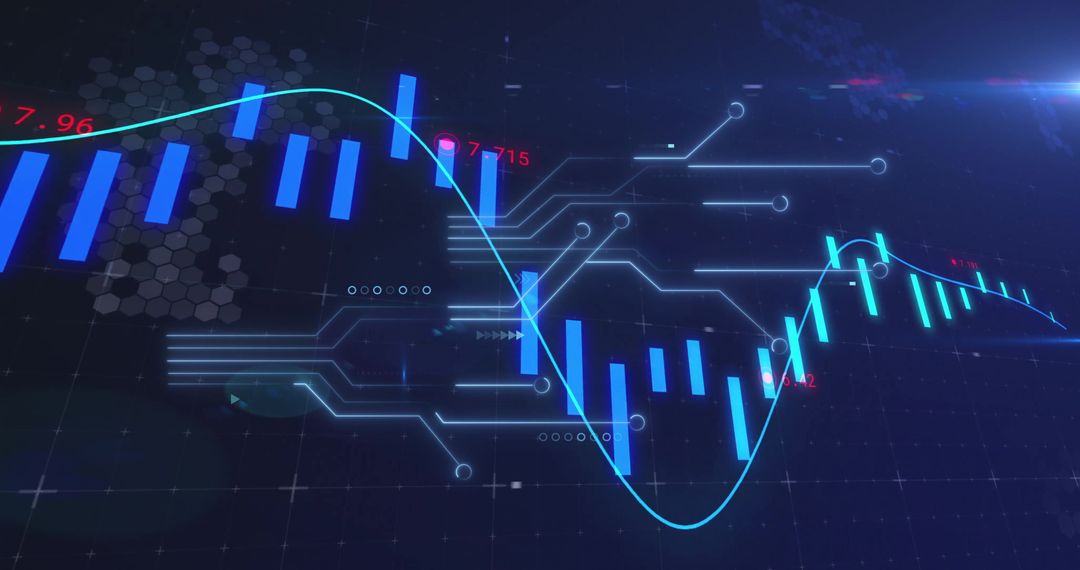
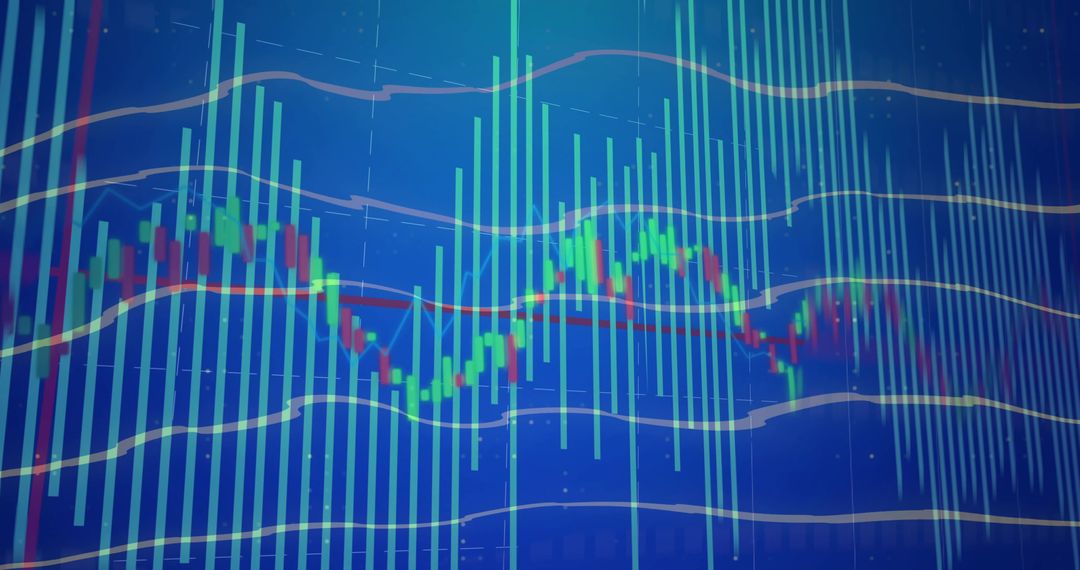
- Neon DNA Double Helix Overlaying Financial Dashboard Visualizing Genomic Data and Analytics
Neon DNA Double Helix Overlaying Financial Dashboard Visualizing Genomic Data and Analytics Image

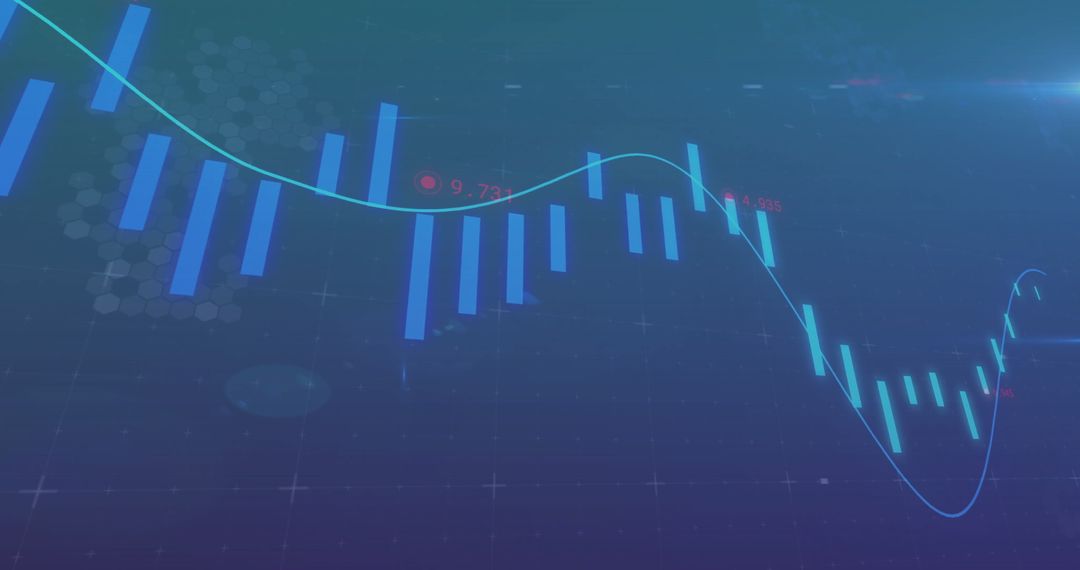
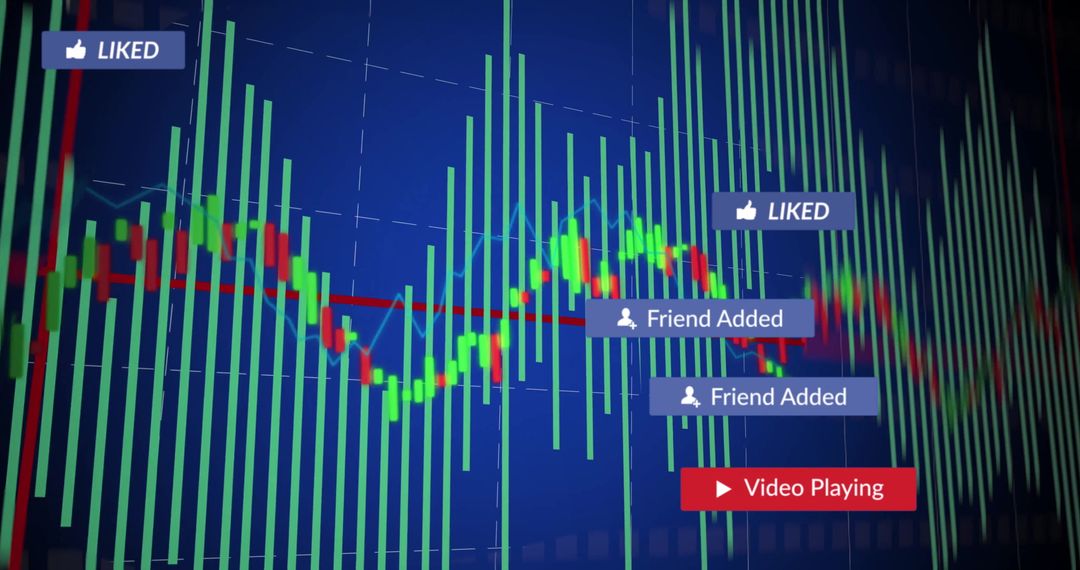
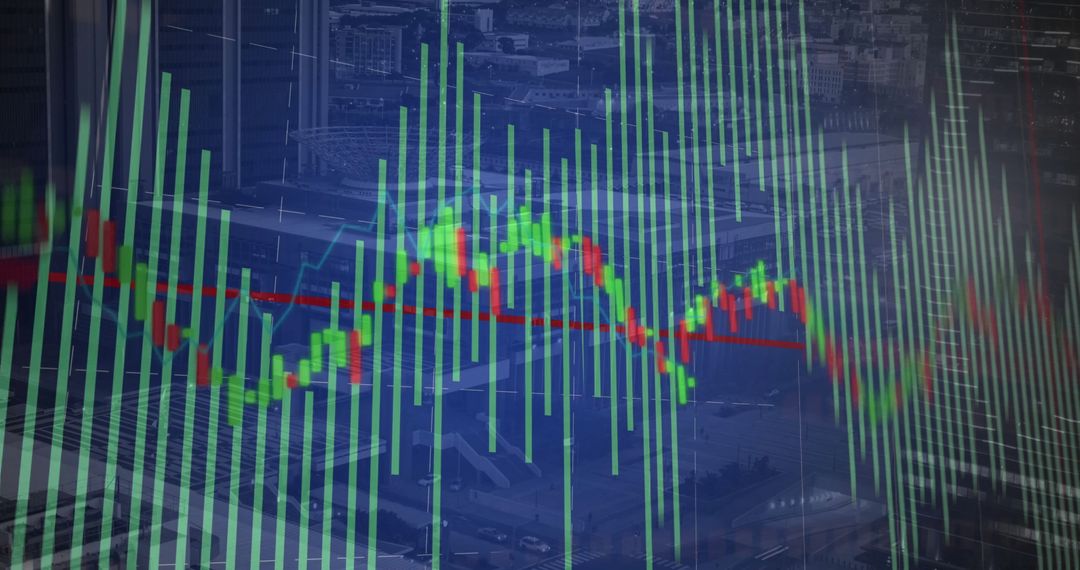
Displaying neon green and magenta double helix overlaid on candlestick charts and vertical bar graphs, creating visual metaphor for convergence of genomics and financial analytics. Combining molecular structure with market data, conveying concept of precision medicine funding, biotech investment analysis, genomic startups and data-driven life sciences strategies. Left side dark copy space allowing text overlay, headlines and logo placement. Perfect for hero banners, website headers, investor decks, research reports, press releases and editorial features. Color palette featuring neon green, magenta, teal and deep blue for high-contrast modern aesthetic. Providing eye-catching visual for marketing campaigns, presentations, infographics, stock market coverage and technology blog posts.
Powered by 


0
downloads
downloads
Tags:
More
Credit Photo
If you would like to credit the Photo, here are some ways you can do so
Text Link
photo Link
<span class="text-link">
<span>
<a target="_blank" href=https://pikwizard.com/photo/neon-dna-double-helix-overlaying-financial-dashboard-visualizing-genomic-data-and-analytics/33831abd540364844032ab524c244c26/>PikWizard</a>
</span>
</span>
<span class="image-link">
<span
style="margin: 0 0 20px 0; display: inline-block; vertical-align: middle; width: 100%;"
>
<a
target="_blank"
href="https://pikwizard.com/photo/neon-dna-double-helix-overlaying-financial-dashboard-visualizing-genomic-data-and-analytics/33831abd540364844032ab524c244c26/"
style="text-decoration: none; font-size: 10px; margin: 0;"
>
<img src="https://pikwizard.com/pw/medium/33831abd540364844032ab524c244c26.jpg" style="margin: 0; width: 100%;" alt="" />
<p style="font-size: 12px; margin: 0;">PikWizard</p>
</a>
</span>
</span>
Free (free of charge)
Free for personal and commercial use.
Author: People Creations
Similar Free Stock Images

Premium


Premium


Premium


Premium


Premium


Premium


Premium


Premium


Premium


Premium


Premium


Premium


Premium


Premium


Premium


Premium


Premium

Premium


Premium


Premium


Premium


Premium


Premium


Premium