- Home >
- Stock Photos >
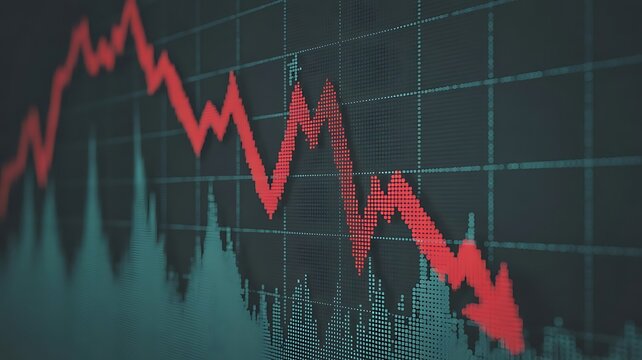
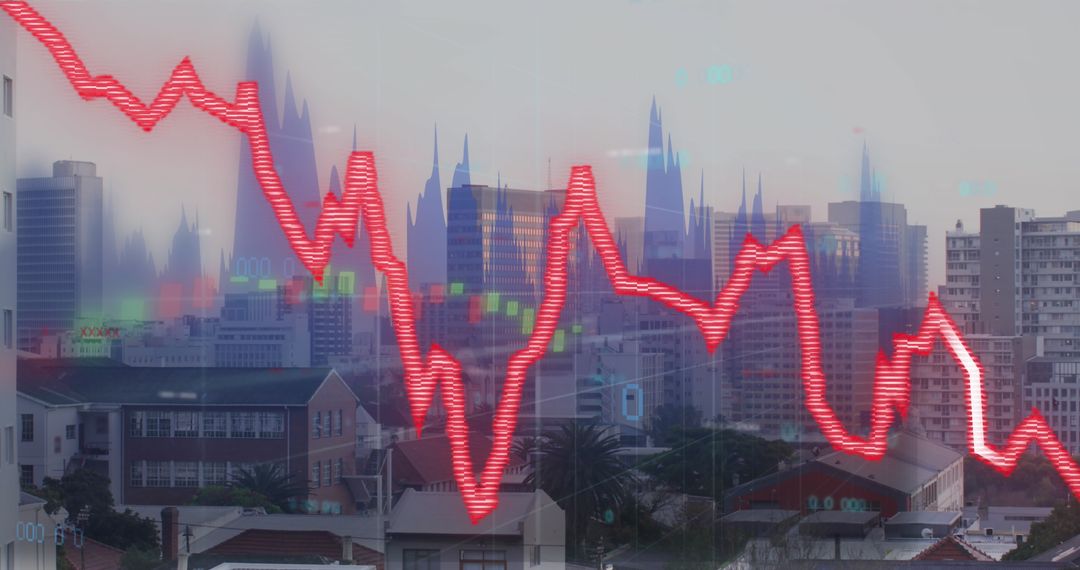
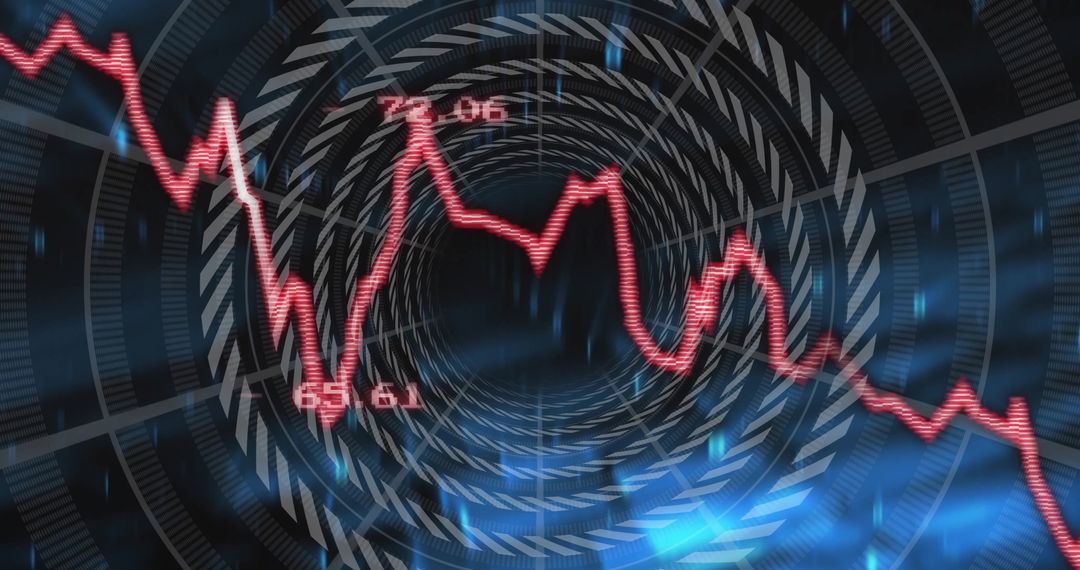
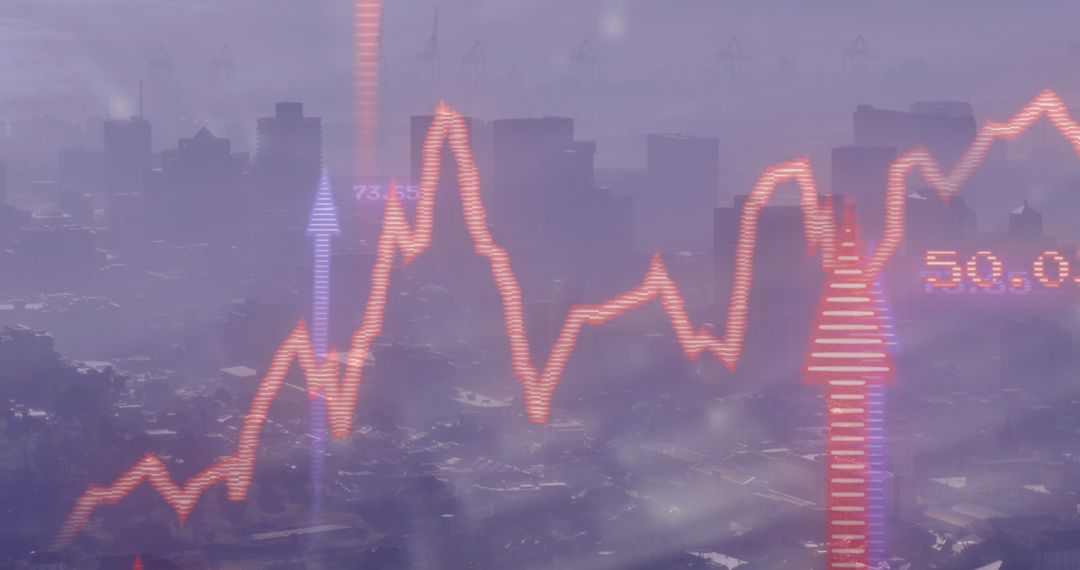
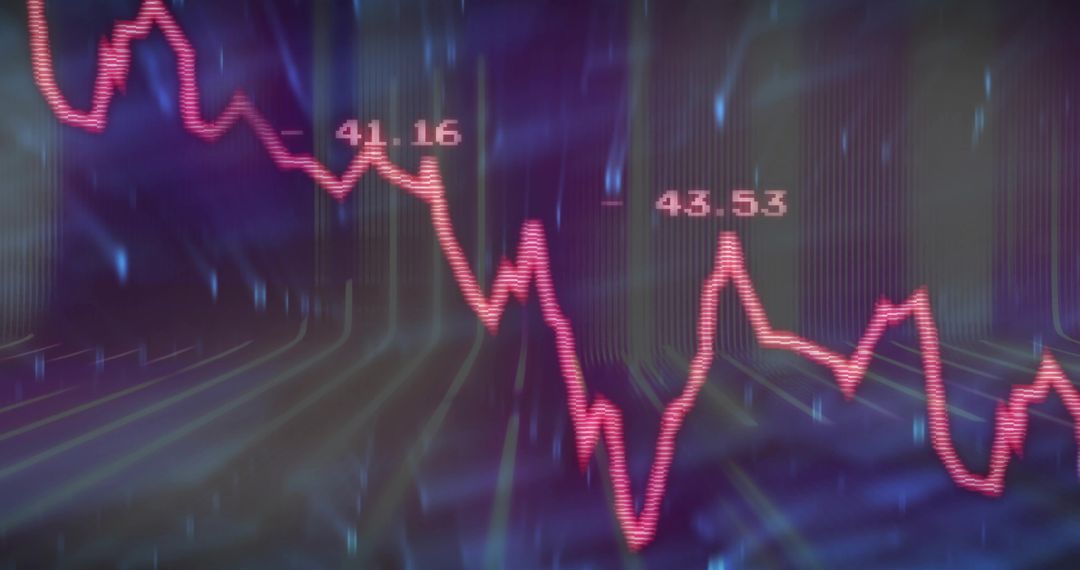
- Neon Red Decline Line Chart Showing -65.09 on Futuristic Blue Grid Dashboard Analytics
Neon Red Decline Line Chart Showing -65.09 on Futuristic Blue Grid Dashboard Analytics Image

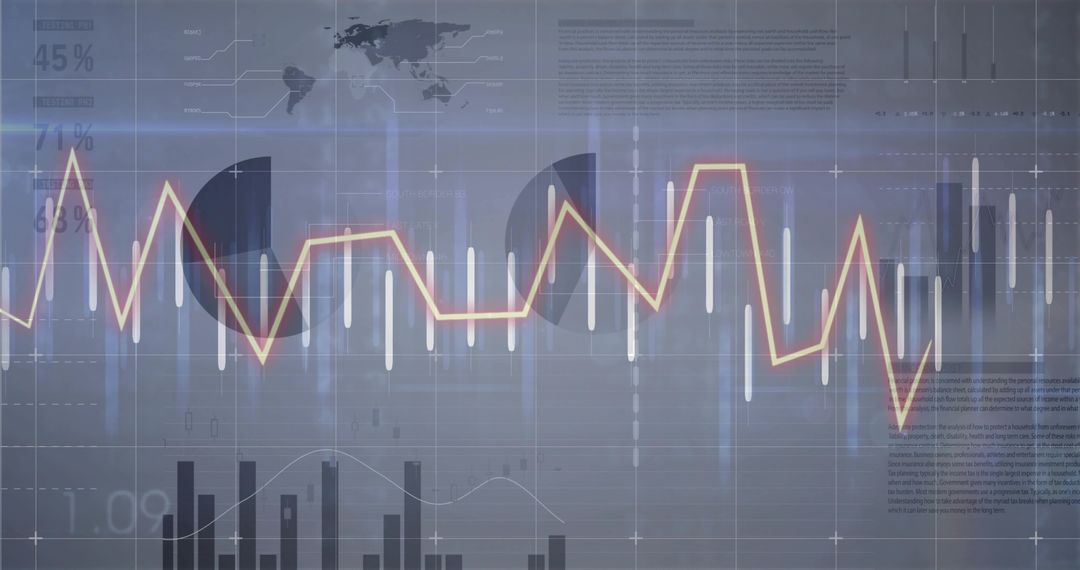
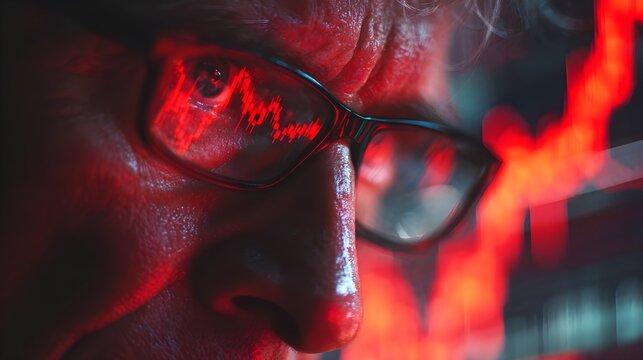
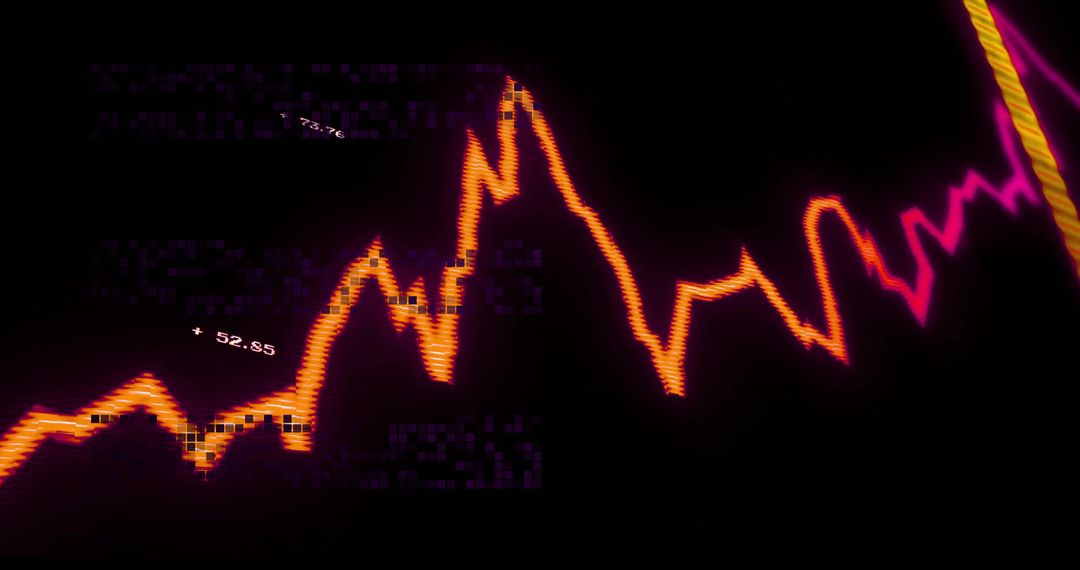
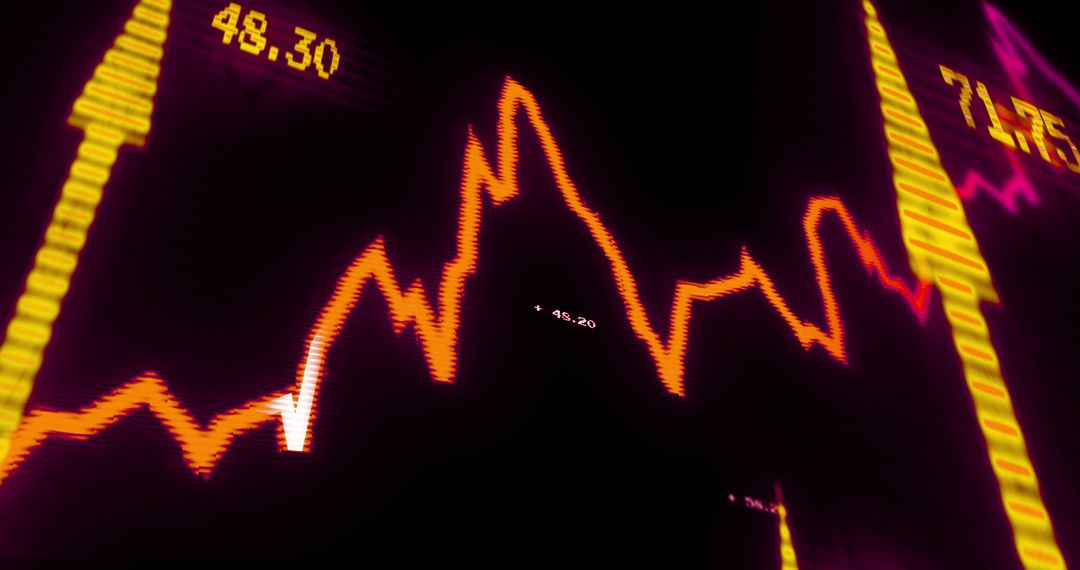
Showing glowing red jagged line tracking sharp decline against futuristic blue grid with numeric readout -65.09. Conveying market volatility, stock market crash, financial loss, economic downturn. Working well for financial news headlines, market analysis reports, investor presentations, earnings call visuals, risk management materials, blog headers, social media posts, broadcast graphics. Providing high contrast and strong negative space for overlaying bold headlines, logos, data callouts, animated effects. Featuring motion blur and neon glow for dramatic, modern aesthetic suitable for tech and fintech branding. Delivering clear visual metaphor for dropping index, portfolio loss, currency devaluation, bearish market trend. Available in wide aspect ratio for web banners and video backgrounds; cropping and color grading working well without losing impact.
Powered by 


0
downloads
downloads
Tags:
More
Credit Photo
If you would like to credit the Photo, here are some ways you can do so
Text Link
photo Link
<span class="text-link">
<span>
<a target="_blank" href=https://pikwizard.com/photo/neon-red-decline-line-chart-showing-65-09-on-futuristic-blue-grid-dashboard-analytics/7f2fda5a3a537da60581c6b7c4b55c46/>PikWizard</a>
</span>
</span>
<span class="image-link">
<span
style="margin: 0 0 20px 0; display: inline-block; vertical-align: middle; width: 100%;"
>
<a
target="_blank"
href="https://pikwizard.com/photo/neon-red-decline-line-chart-showing-65-09-on-futuristic-blue-grid-dashboard-analytics/7f2fda5a3a537da60581c6b7c4b55c46/"
style="text-decoration: none; font-size: 10px; margin: 0;"
>
<img src="https://pikwizard.com/pw/medium/7f2fda5a3a537da60581c6b7c4b55c46.jpg" style="margin: 0; width: 100%;" alt="" />
<p style="font-size: 12px; margin: 0;">PikWizard</p>
</a>
</span>
</span>
Free (free of charge)
Free for personal and commercial use.
Author: Creative Art
Similar Free Stock Images

Premium


Premium


Premium


Premium


Premium


Premium


Premium


Premium


Premium


Premium


Premium


Premium


Premium


Premium


Premium


Premium


Premium


Premium


Premium


Premium


Premium


Premium


Premium


Premium