- Home >
- Stock Photos >
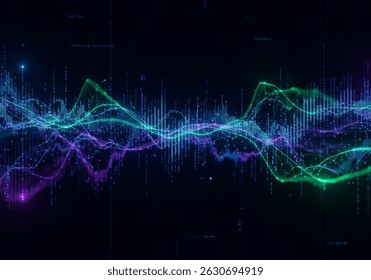
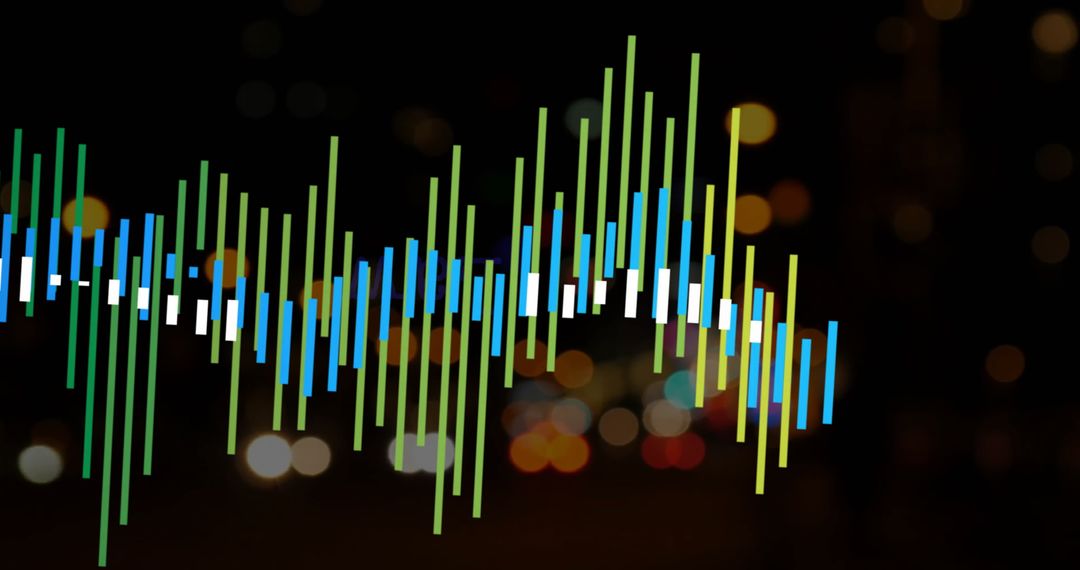
- Pulsing neon audio spectrum with glowing equalizer bars over abstract light trails
Pulsing neon audio spectrum with glowing equalizer bars over abstract light trails Image
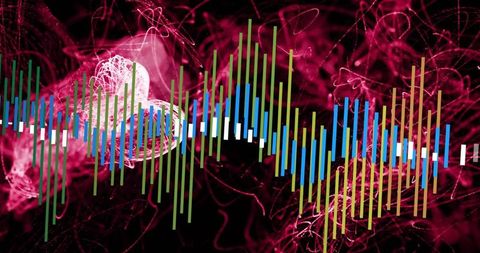
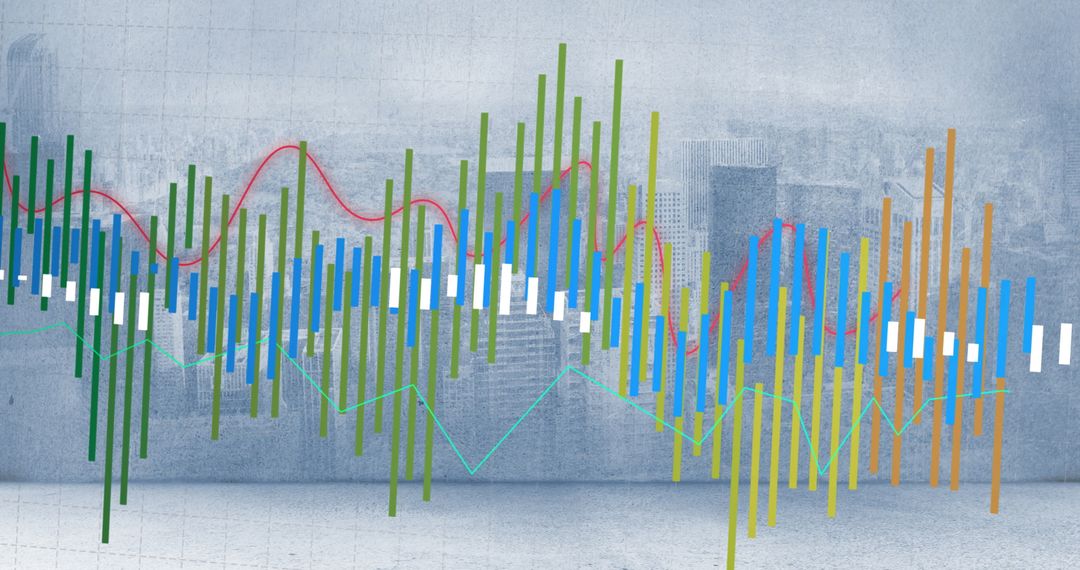
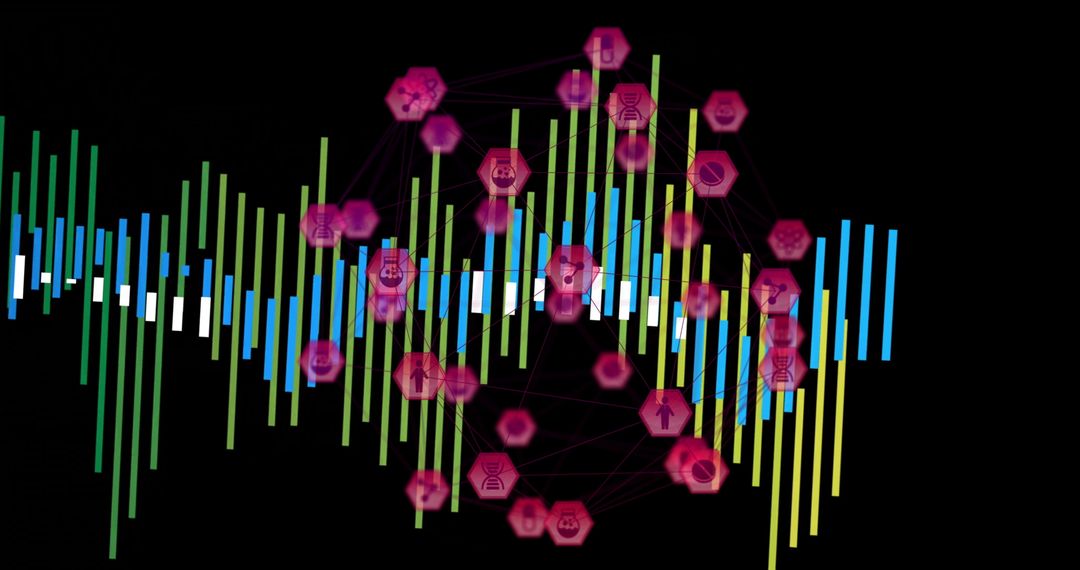
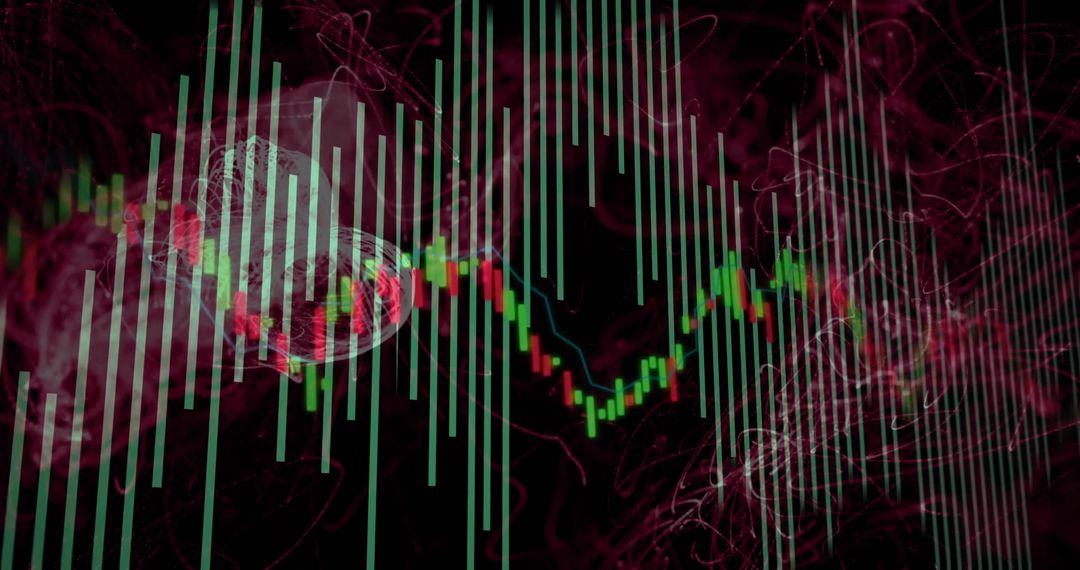
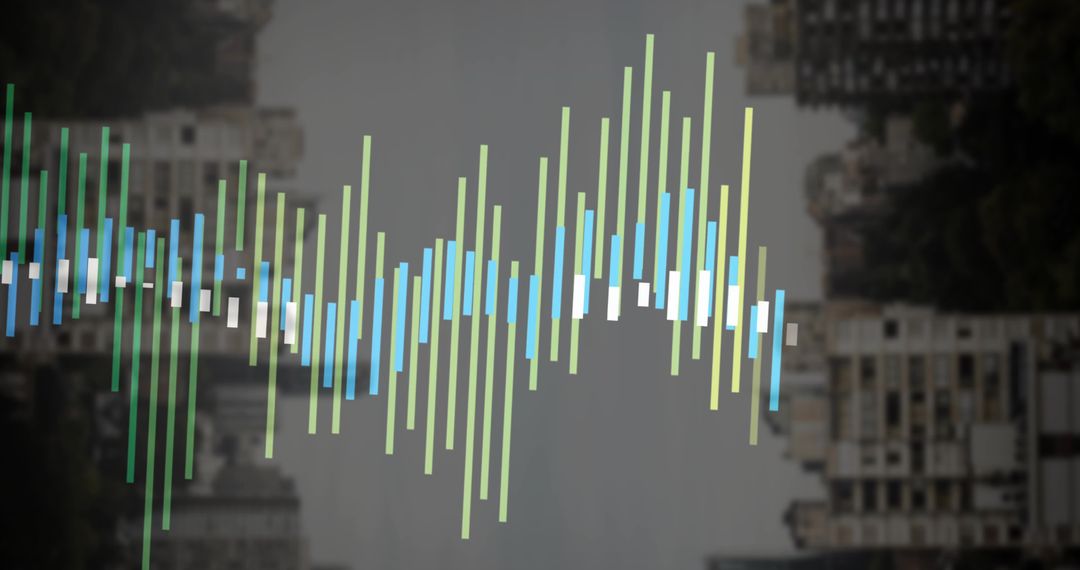
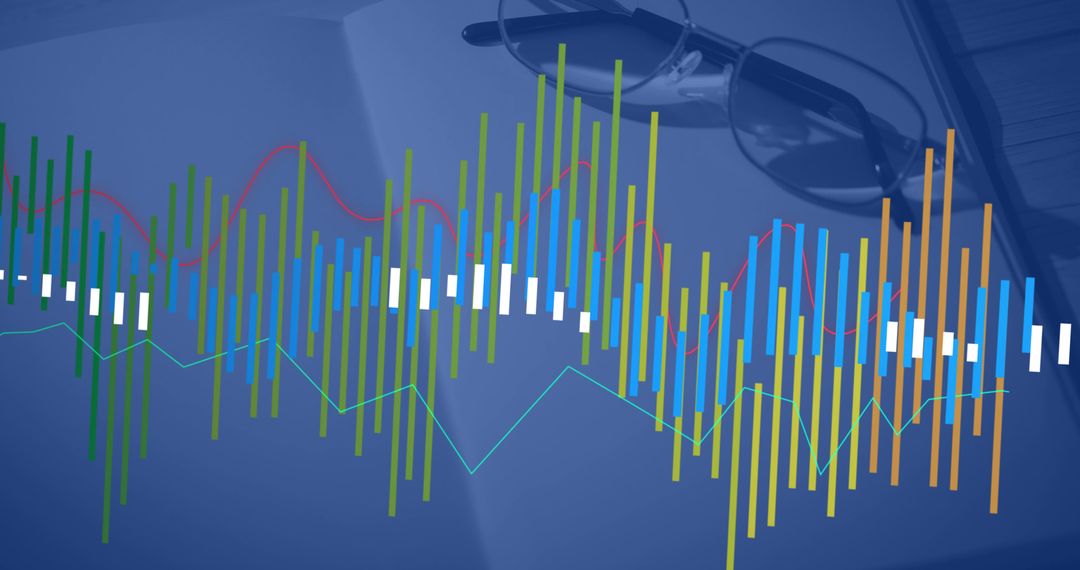
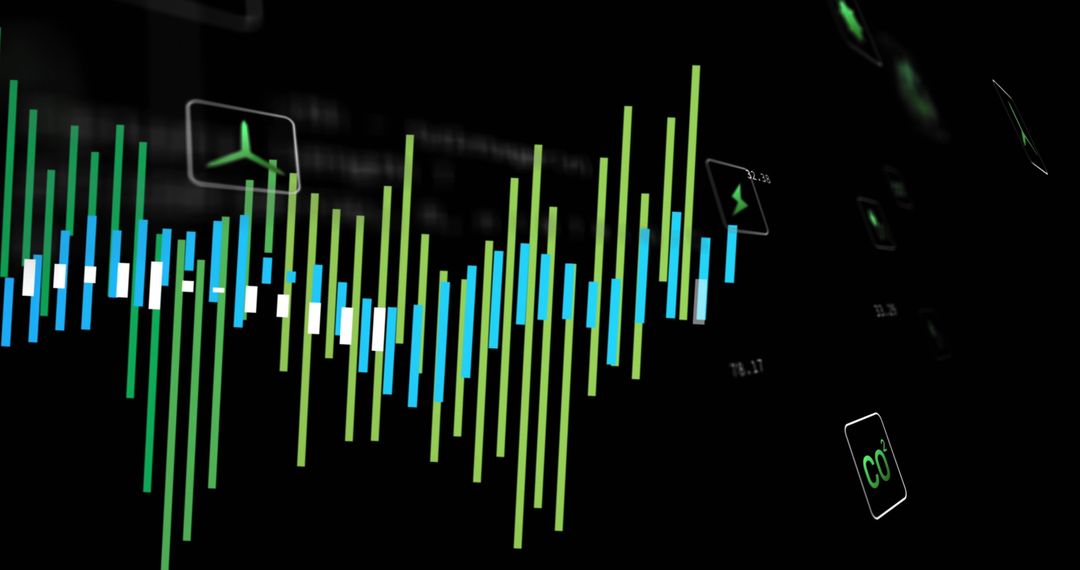
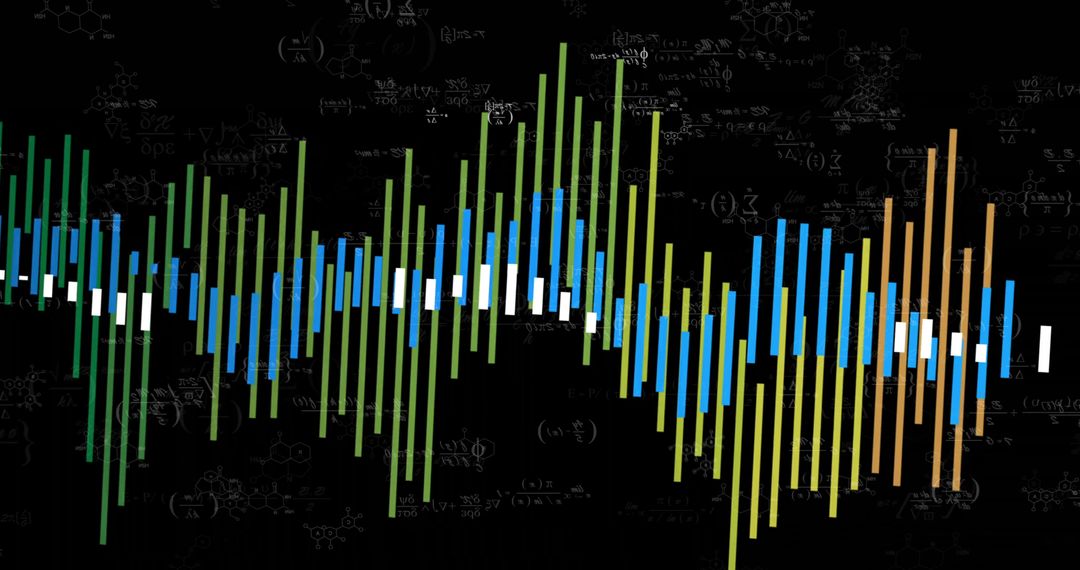
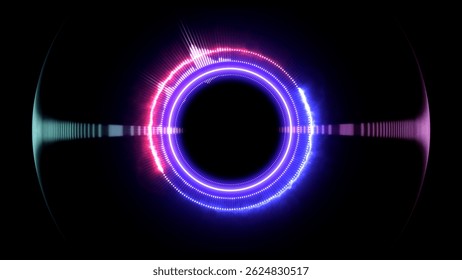
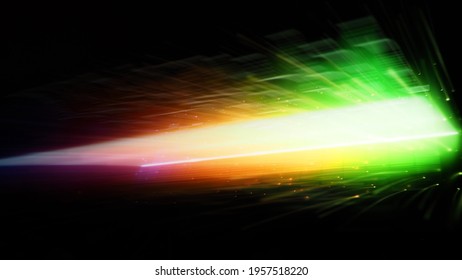
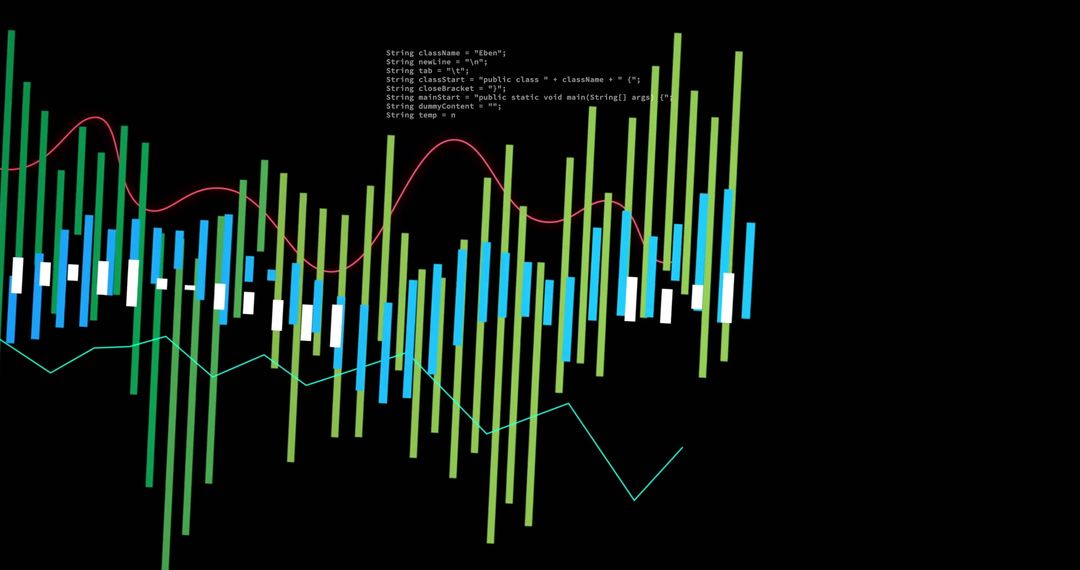
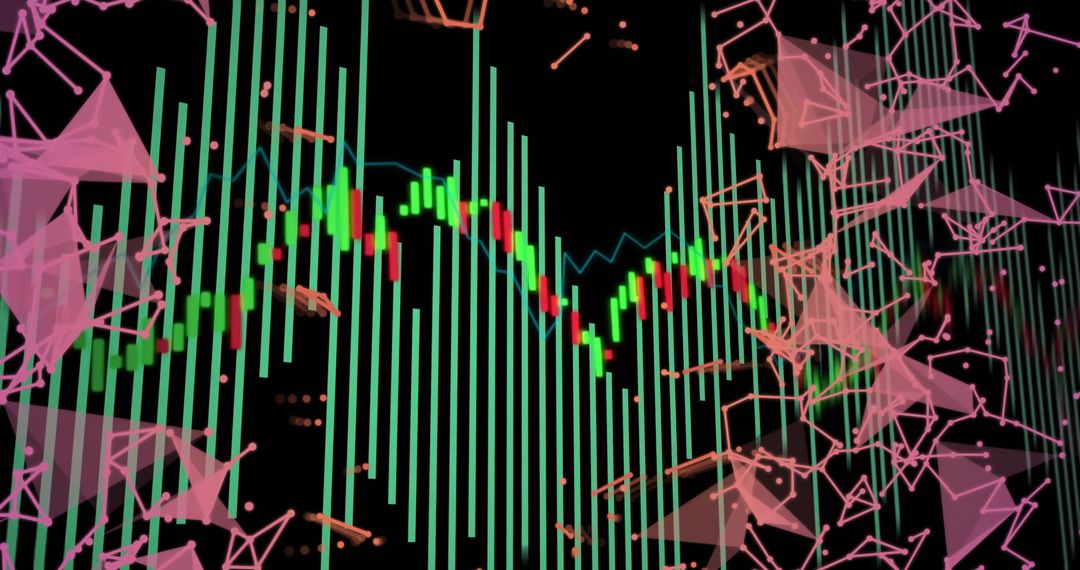
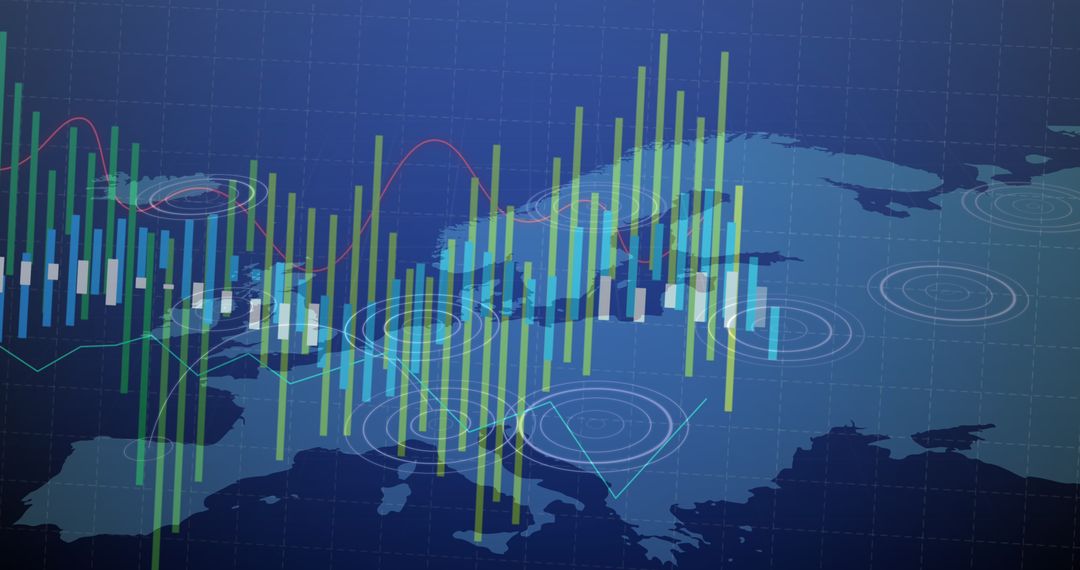
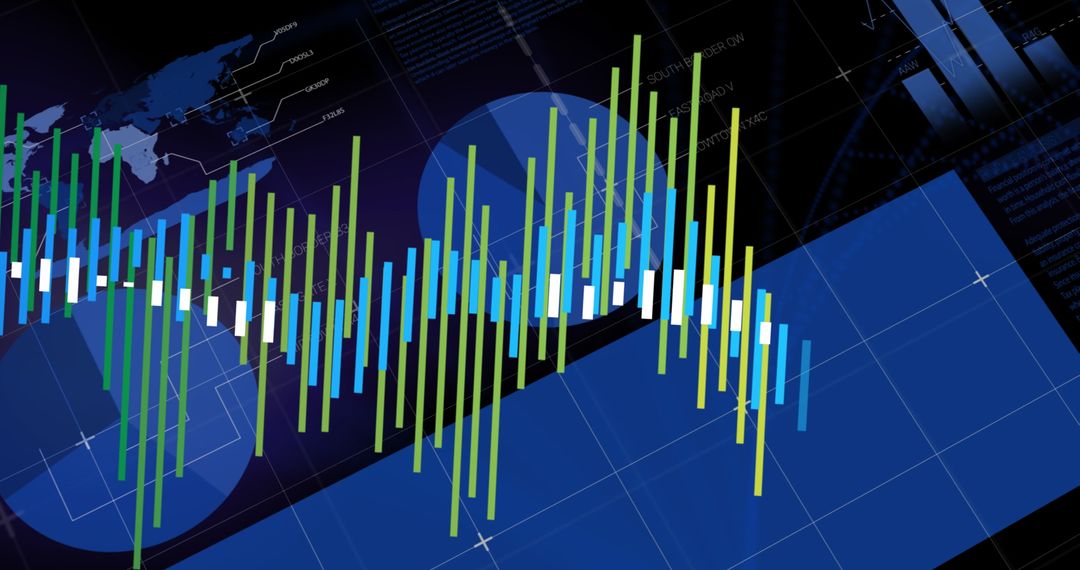
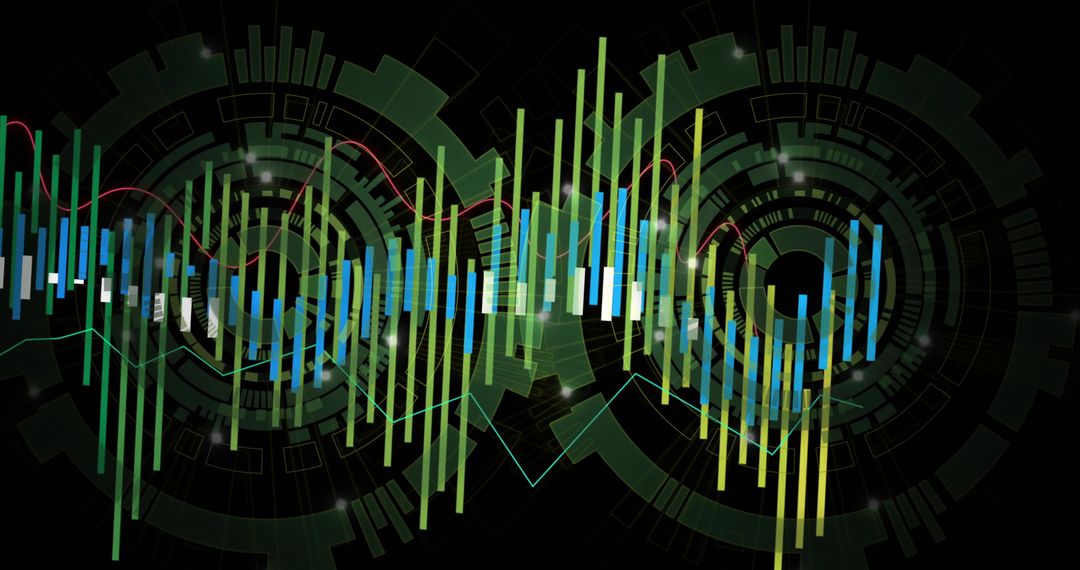
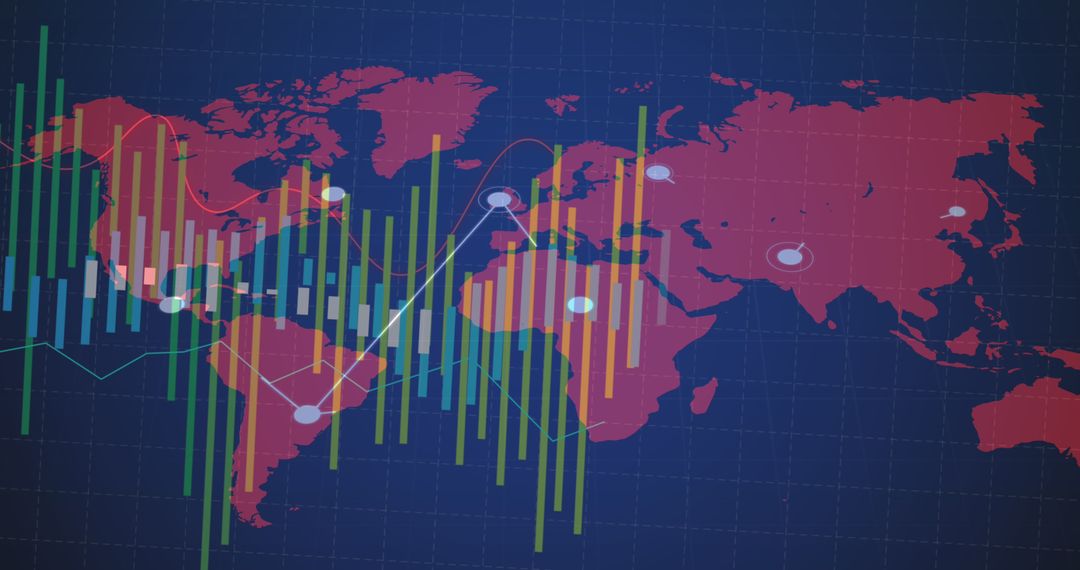
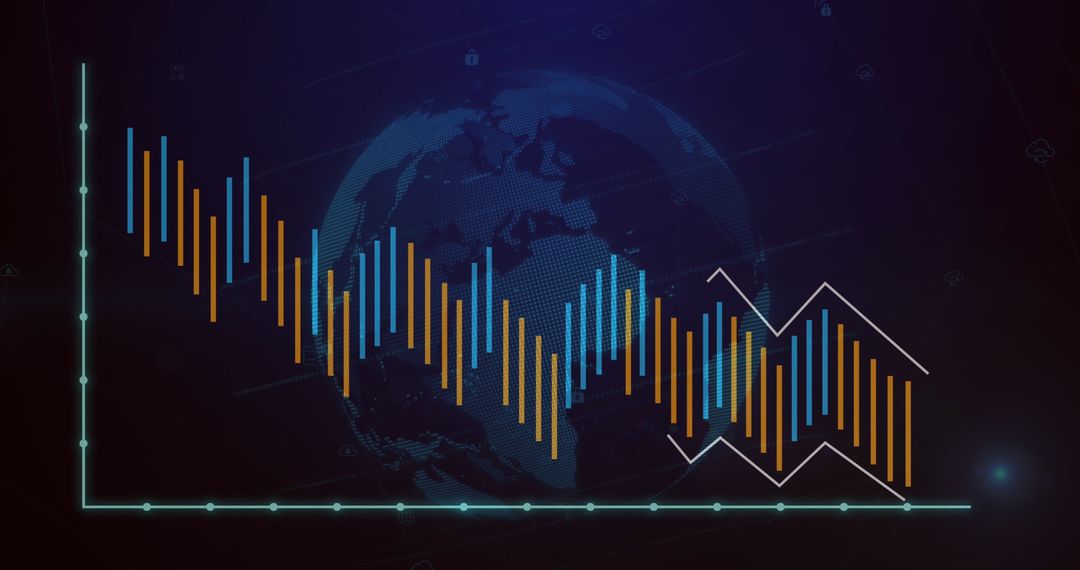
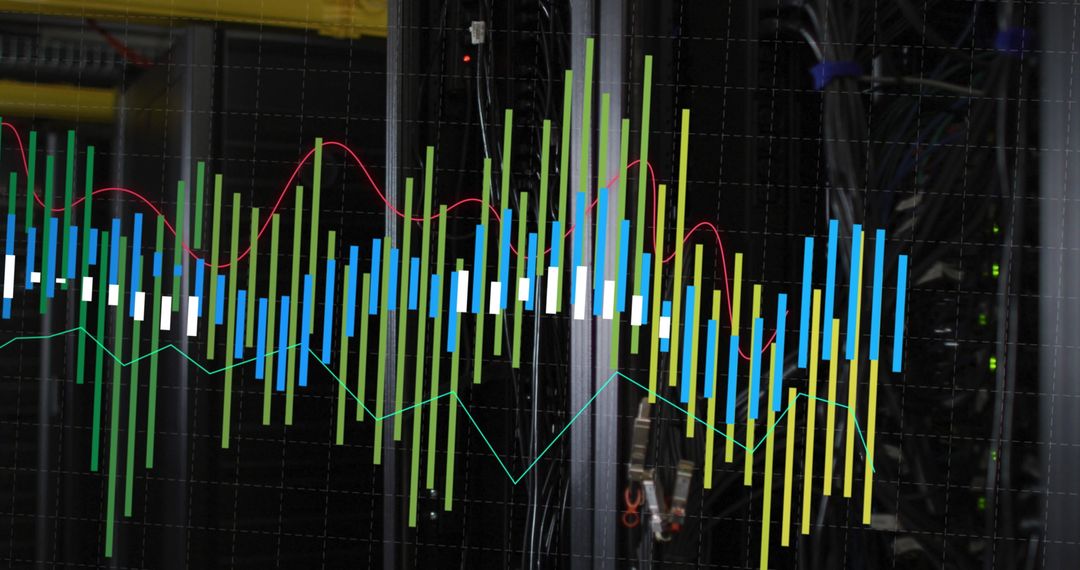
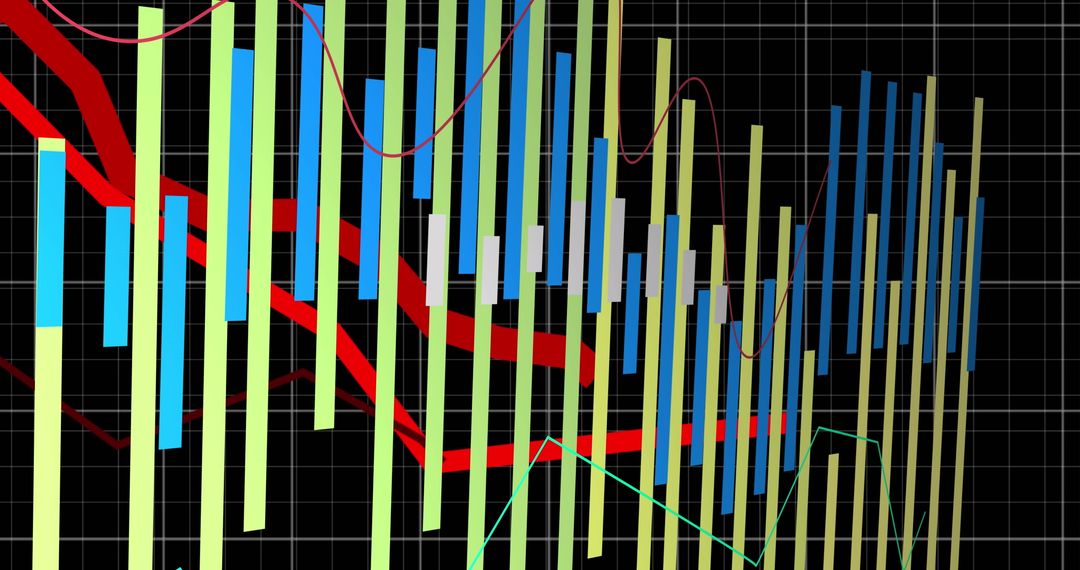
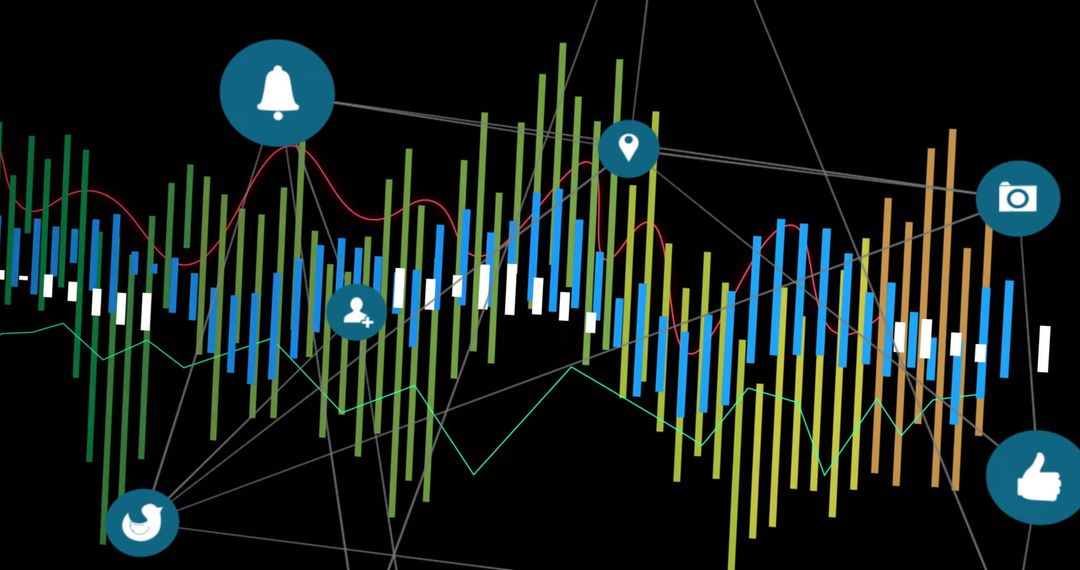
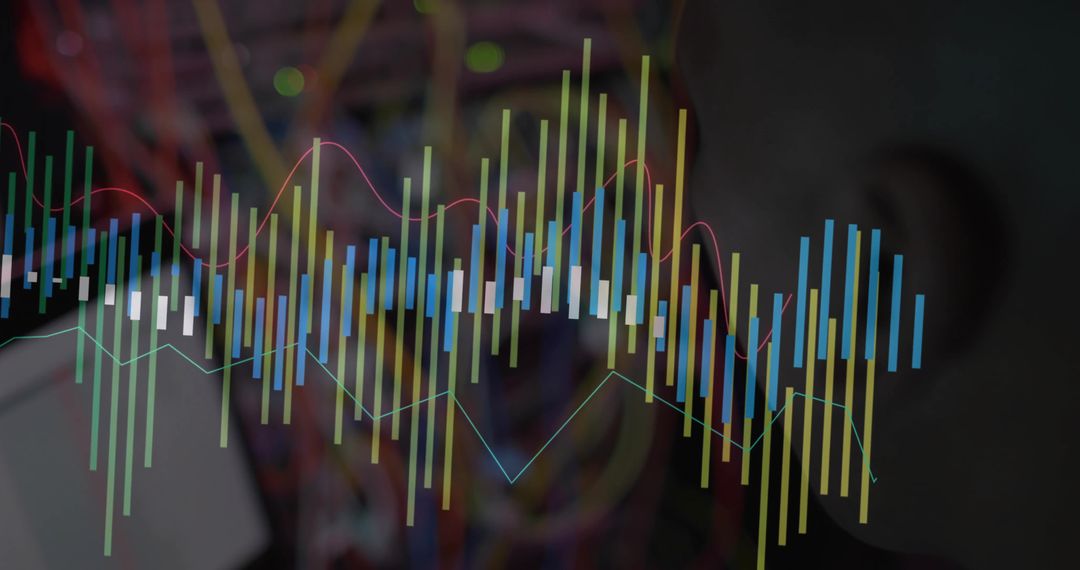
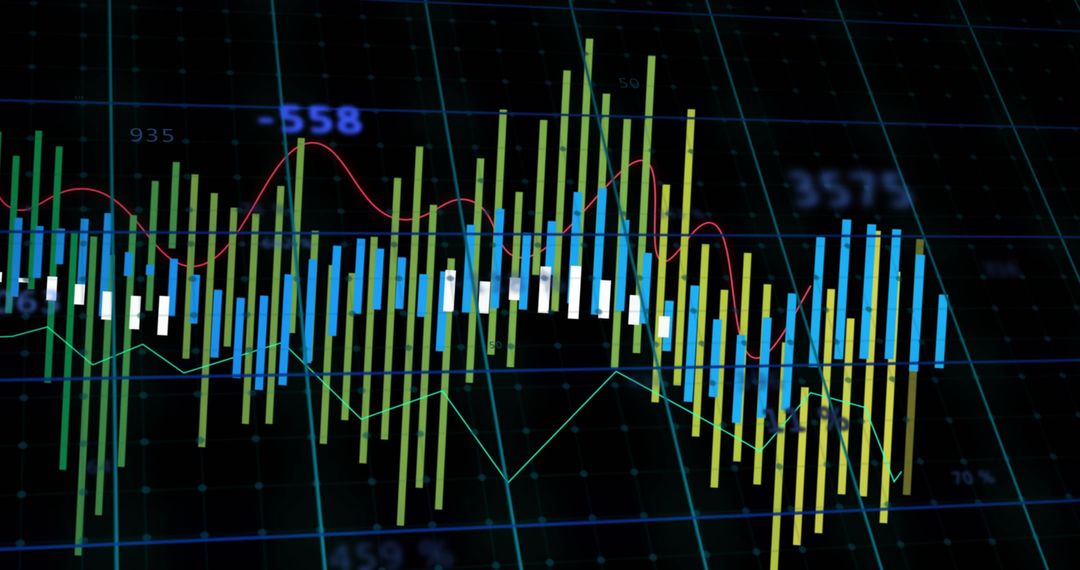
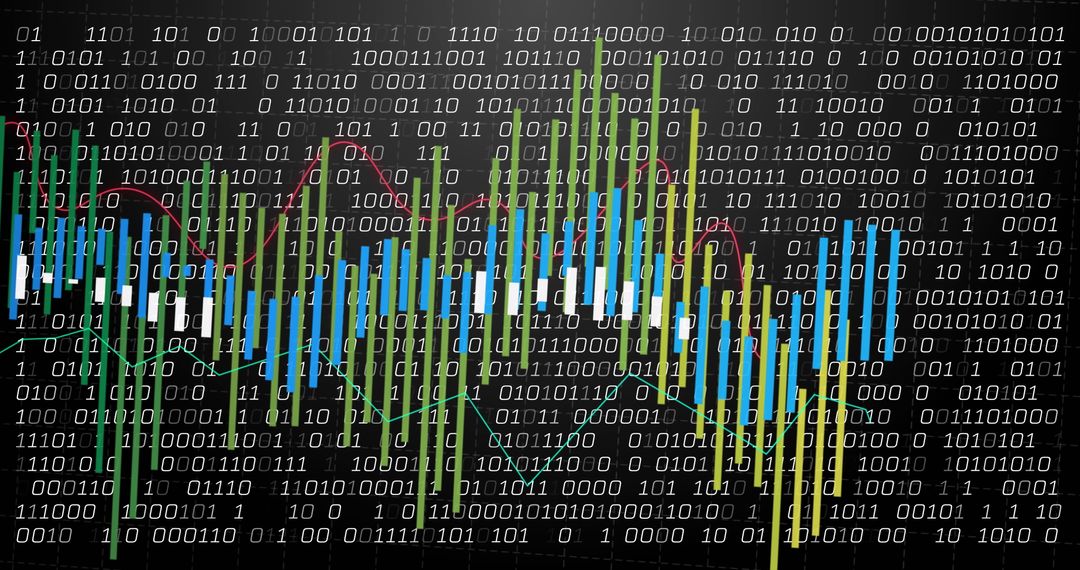
Featuring pulsing neon equalizer bars in green, blue, white layered over swirling magenta light trails and particle nodes, this digital waveform graphic is conveying energy, rhythm, motion. Suited for album covers, event posters, DJ flyers, music streaming visuals, video intros, website headers, social media banners, electronic music promotions, tech product presentations. Working well as background for audio apps, podcast artwork, VJ loops, live performance visuals, advertising campaigns. Offering strong contrast and dynamic composition for eye-catching display, with transparent overlay and spacing allowing easy text placement and logo integration. Recommending color grading and layer blending for brand customization and seamless integration into motion graphics or print materials.
Powered by  - Get 15% off with code: PIKWIZARD15


0
downloads
downloads
Tags:
More
Credit Photo
If you would like to credit the Photo, here are some ways you can do so
Text Link
photo Link
<span class="text-link">
<span>
<a target="_blank" href=https://pikwizard.com/photo/pulsing-neon-audio-spectrum-with-glowing-equalizer-bars-over-abstract-light-trails/849d38694a04a04f6415a30ce6b0a0e8/>PikWizard</a>
</span>
</span>
<span class="image-link">
<span
style="margin: 0 0 20px 0; display: inline-block; vertical-align: middle; width: 100%;"
>
<a
target="_blank"
href="https://pikwizard.com/photo/pulsing-neon-audio-spectrum-with-glowing-equalizer-bars-over-abstract-light-trails/849d38694a04a04f6415a30ce6b0a0e8/"
style="text-decoration: none; font-size: 10px; margin: 0;"
>
<img src="https://pikwizard.com/pw/medium/849d38694a04a04f6415a30ce6b0a0e8.jpg" style="margin: 0; width: 100%;" alt="" />
<p style="font-size: 12px; margin: 0;">PikWizard</p>
</a>
</span>
</span>
Free (free of charge)
Free for personal and commercial use.
Author: Authentic Images
Similar Free Stock Images

Premium


Premium


Premium


Premium


Premium


Premium

Premium


Premium


Premium


Premium


Premium


Premium


Premium


Premium


Premium