- Home >
- Stock Photos >
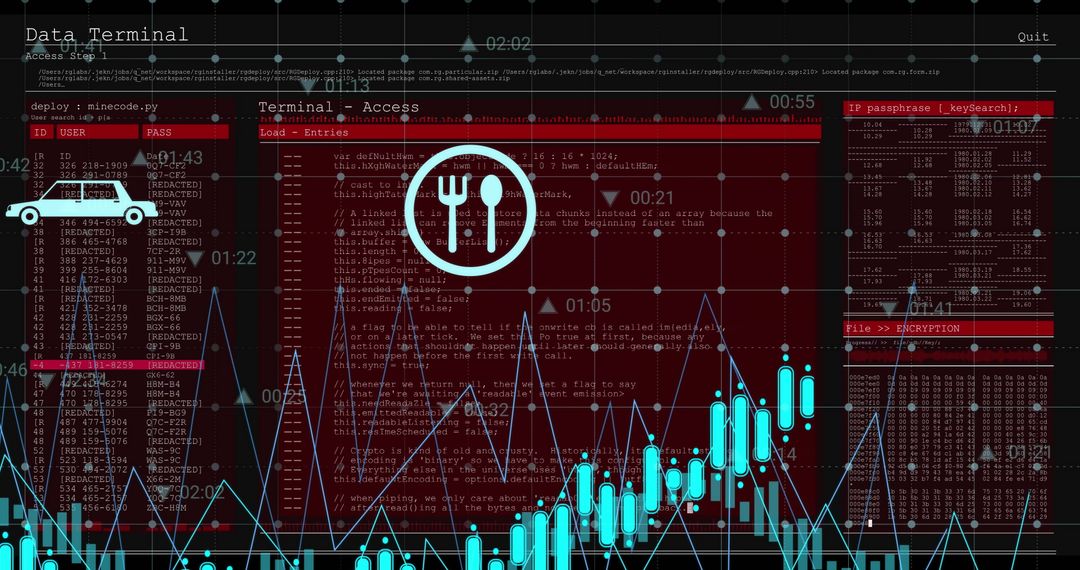
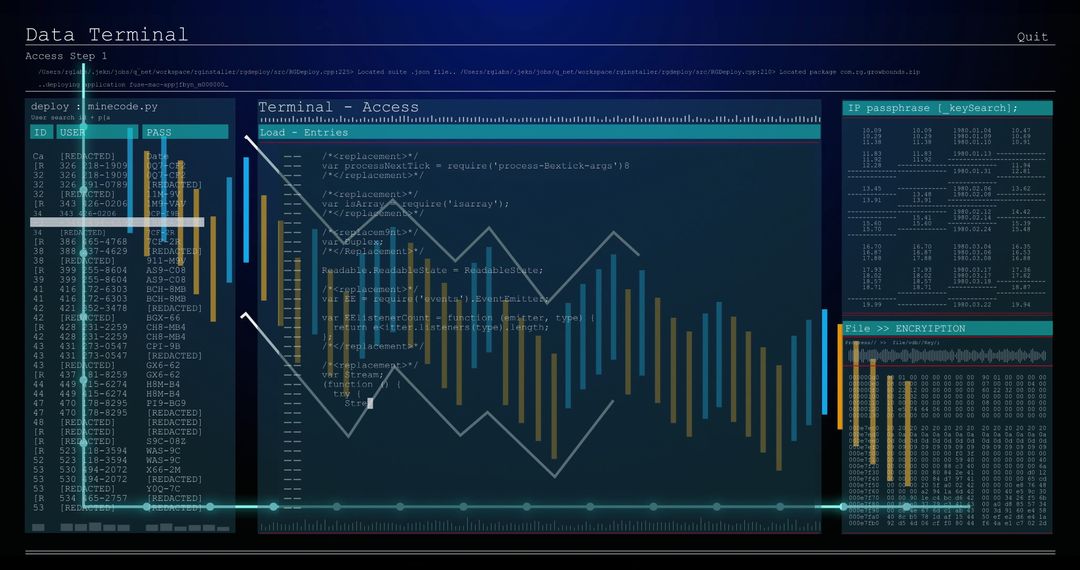
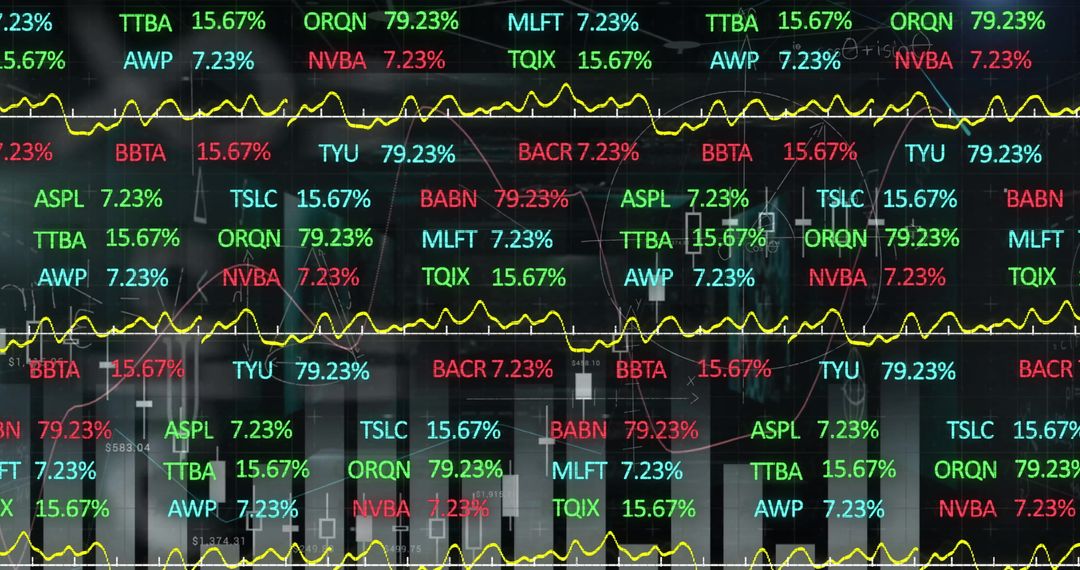
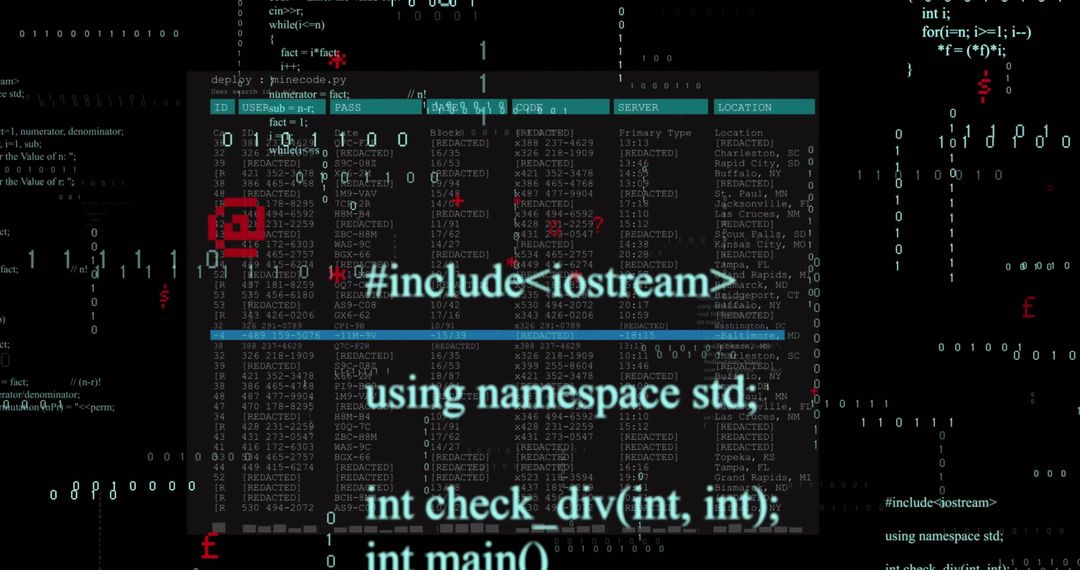
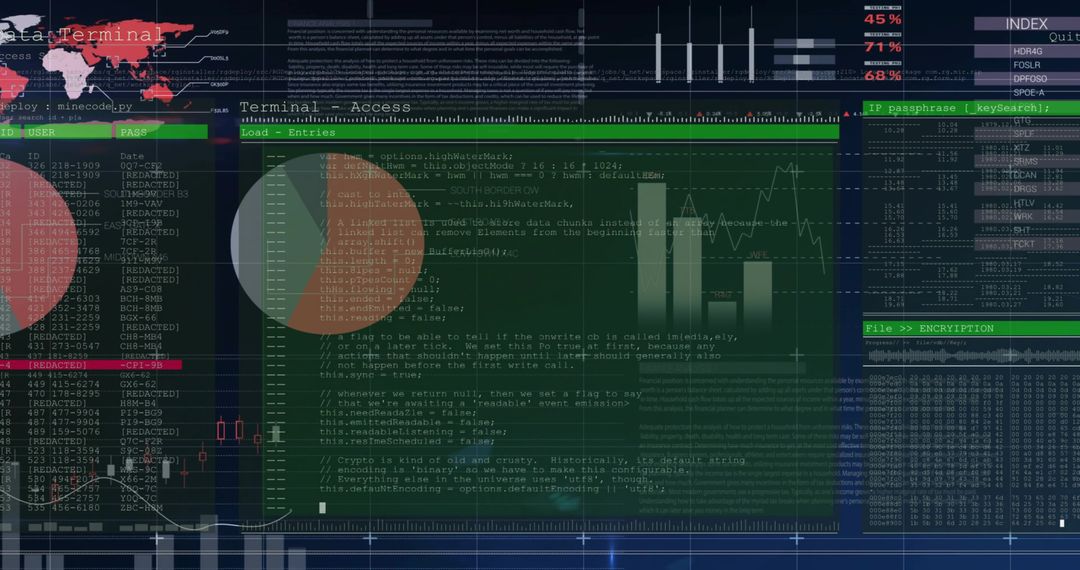
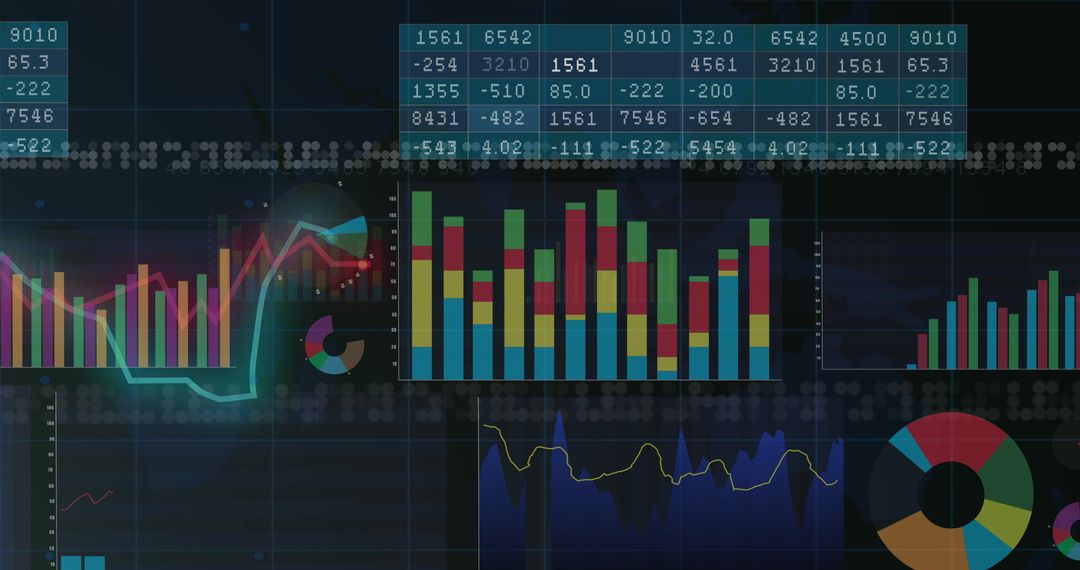
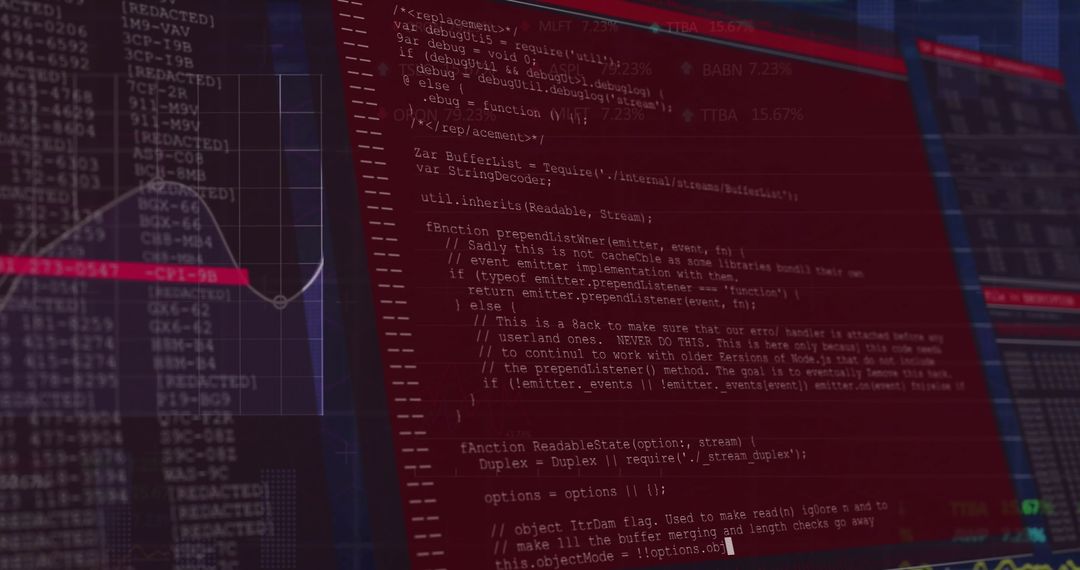
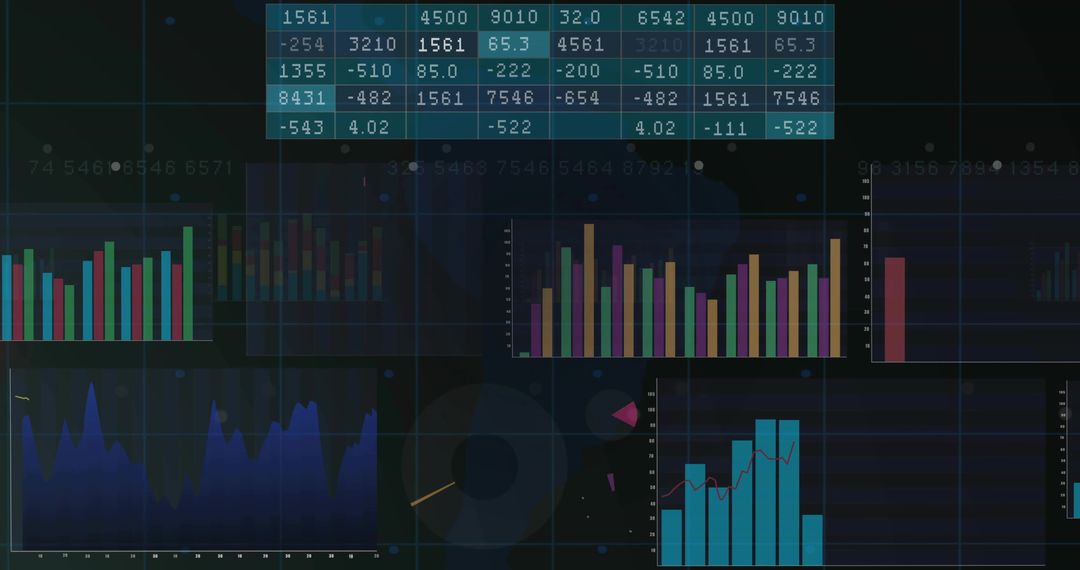
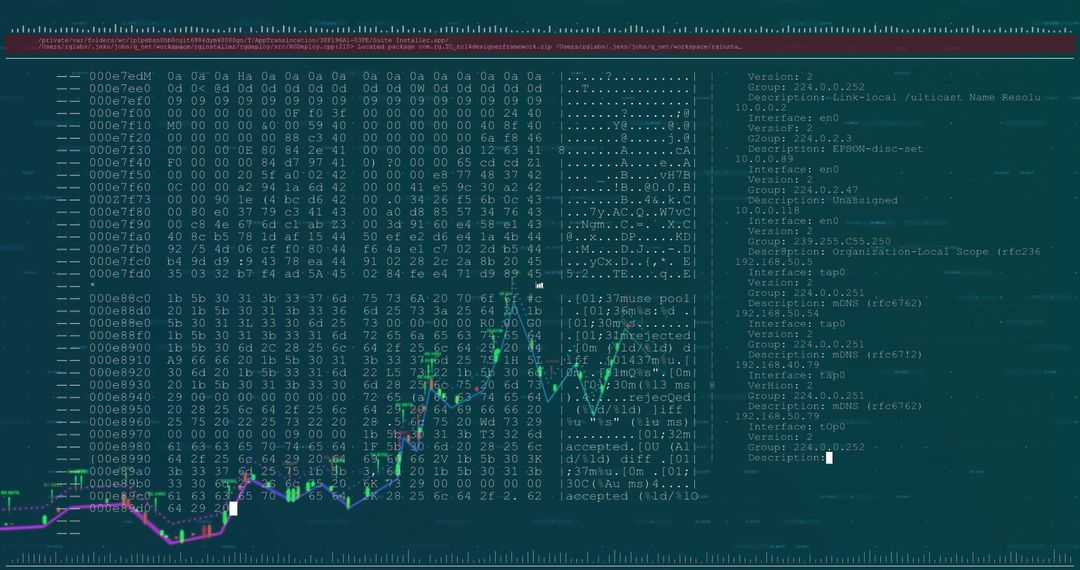
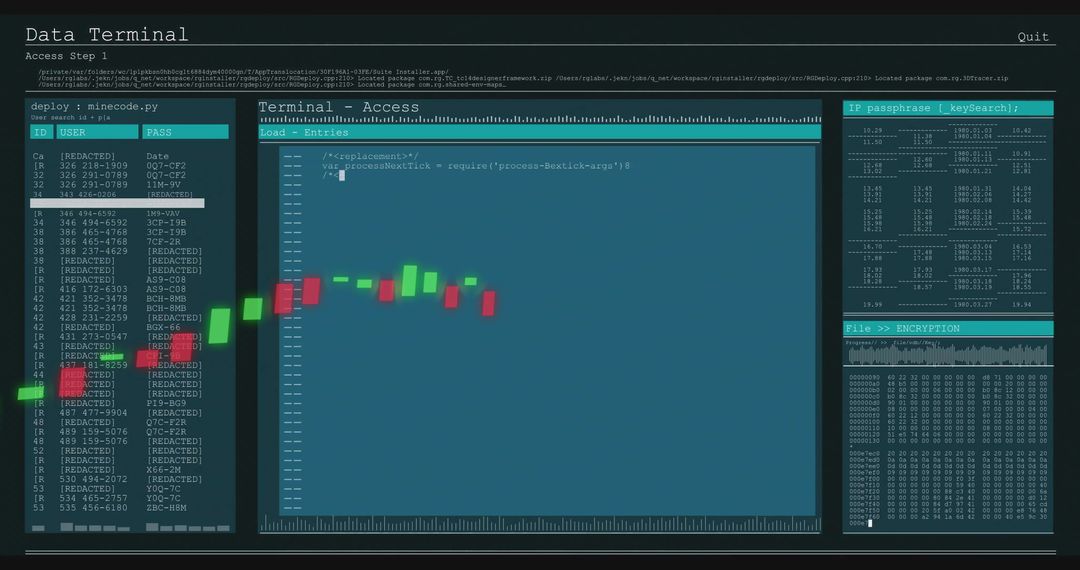
- Red Cyber Terminal Showing Teal Bar Charts and White-Red Line Graphs for Analytics
Red Cyber Terminal Showing Teal Bar Charts and White-Red Line Graphs for Analytics Image
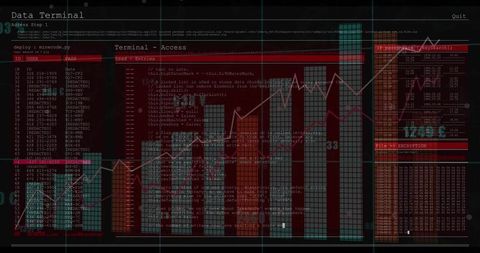
Dark red terminal layout showing teal bar charts, white and red line graphs, mono logs and code snippets. High-contrast cyber aesthetic suiting cybersecurity, data analytics, IT monitoring and threat detection projects. Working well for website hero banners, technology blog headers, security reports, investor decks, presentation slides, product mockups and marketing campaigns. Crop-friendly composition allowing safe-space for text and logo overlays on left column. Color palette featuring deep red, teal and cyan providing dramatic contrast for white typography. Layered design allowing headline and call-to-action placement. Ideal for creating visual identity for security software, SOC dashboards, incident response guides and training materials.
Powered by  - Get 15% off with code: PIKWIZARD15


0
downloads
downloads
Tags:
More
Credit Photo
If you would like to credit the Photo, here are some ways you can do so
Text Link
photo Link
<span class="text-link">
<span>
<a target="_blank" href=https://pikwizard.com/photo/red-cyber-terminal-showing-teal-bar-charts-and-white-red-line-graphs-for-analytics/99bd707e9ef576b0a9fae49b5db83fda/>PikWizard</a>
</span>
</span>
<span class="image-link">
<span
style="margin: 0 0 20px 0; display: inline-block; vertical-align: middle; width: 100%;"
>
<a
target="_blank"
href="https://pikwizard.com/photo/red-cyber-terminal-showing-teal-bar-charts-and-white-red-line-graphs-for-analytics/99bd707e9ef576b0a9fae49b5db83fda/"
style="text-decoration: none; font-size: 10px; margin: 0;"
>
<img src="https://pikwizard.com/pw/medium/99bd707e9ef576b0a9fae49b5db83fda.jpg" style="margin: 0; width: 100%;" alt="" />
<p style="font-size: 12px; margin: 0;">PikWizard</p>
</a>
</span>
</span>
Free (free of charge)
Free for personal and commercial use.
Author: Awesome Content
Similar Free Stock Images

Premium


Premium


Premium


Premium


Premium


Premium


Premium


Premium


Premium


Premium


Premium

Premium


Premium


Premium


Premium


Premium


Premium


Premium


Premium


Premium


Premium


Premium


Premium


Premium