
- Home >
- Stock Videos >
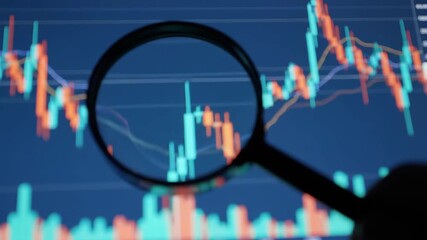
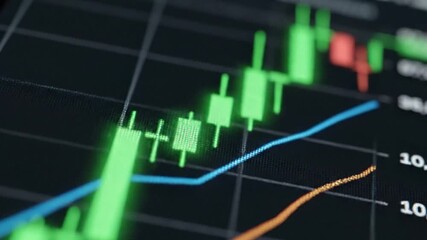
- Abstract Digital Visualization of Financial Data with Graphs and Charts
Abstract Digital Visualization of Financial Data with Graphs and Charts Video
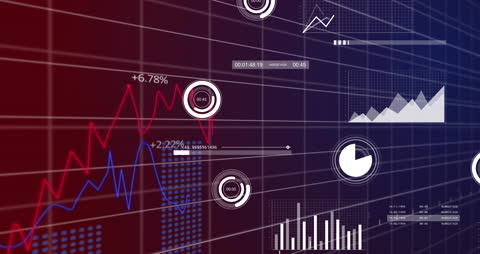
Dynamic depiction of financial data integrated with various animated graphs and charts. Useful for presentations on business analytics, stock market insights, or economic forecast reports. Great for illustrating complex data interpretations in a visually engaging manner for corporate or educational purposes.
Powered by 


0
downloads
downloads
Tags:
More
Credit Photo
If you would like to credit the Photo, here are some ways you can do so
Text Link
video Link
<span class="text-link">
<span>
<a target="_blank" href=https://pikwizard.com/video/abstract-digital-visualization-of-financial-data-with-graphs-and-charts/a552d04d5a3136a457a0455d4f7adce7/>PikWizard</a>
</span>
</span>
<span class="image-link">
<span
style="margin: 0 0 20px 0; display: inline-block; vertical-align: middle; width: 100%;"
>
<a
target="_blank"
href="https://pikwizard.com/video/abstract-digital-visualization-of-financial-data-with-graphs-and-charts/a552d04d5a3136a457a0455d4f7adce7/"
style="text-decoration: none; font-size: 10px; margin: 0;"
>
<video controls style="width: 100%; margin: 0;">
<source src="https://player.vimeo.com/progressive_redirect/playback/812609118/rendition/240p/file.mp4?loc=external&oauth2_token_id=1223210874&signature=57ecdf18c118e2fc9fa051dc4429f12f6c5a0dd3db5afacb16a2a28659a7963e" type="video/mp4"
poster="https://pikwizard.com/pw/medium/a552d04d5a3136a457a0455d4f7adce7.jpg"/>
Your browser does not support the video tag.
</video>
<p style="font-size: 12px; margin: 0;">PikWizard</p>
</a>
</span>
</span>
Free (free of charge)
Free for personal and commercial use.
Author: Awesome Content
Similar Free Stock Videos
Loading...