
- Home >
- Stock Videos >
- Animated Data Processing with Graphs and Statistics on Digital Interface
Animated Data Processing with Graphs and Statistics on Digital Interface Video
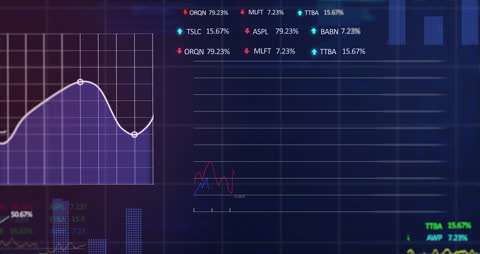
This visual features animation of data being processed with graphs and statistics on a sleek digital interface. Useful for presentations on financial technology, global business strategies, data analysis, or innovations in digital interfaces.

downloads
Tags:
More
Credit Photo
If you would like to credit the Photo, here are some ways you can do so
Text Link
video Link
<span class="text-link">
<span>
<a target="_blank" href=https://pikwizard.com/video/animated-data-processing-with-graphs-and-statistics-on-digital-interface/eaa0c144f93b07abdef49460d26f277c/>PikWizard</a>
</span>
</span>
<span class="image-link">
<span
style="margin: 0 0 20px 0; display: inline-block; vertical-align: middle; width: 100%;"
>
<a
target="_blank"
href="https://pikwizard.com/video/animated-data-processing-with-graphs-and-statistics-on-digital-interface/eaa0c144f93b07abdef49460d26f277c/"
style="text-decoration: none; font-size: 10px; margin: 0;"
>
<video controls style="width: 100%; margin: 0;">
<source src="https://player.vimeo.com/progressive_redirect/playback/718915683/rendition/240p/file.mp4?loc=external&oauth2_token_id=1223210874&signature=c05abe930fe5a59f9acddc11d42290c6111cec09e2d42394078ce2ac8fedac5c" type="video/mp4"
poster="https://pikwizard.com/pw/medium/eaa0c144f93b07abdef49460d26f277c.jpg"/>
Your browser does not support the video tag.
</video>
<p style="font-size: 12px; margin: 0;">PikWizard</p>
</a>
</span>
</span>
Free (free of charge)
Free for personal and commercial use.
Author: Awesome Content