
- Home >
- Stock Videos >
- Animated Holographic Interface with Stock Market Trends and Coding Visuals
Animated Holographic Interface with Stock Market Trends and Coding Visuals Video
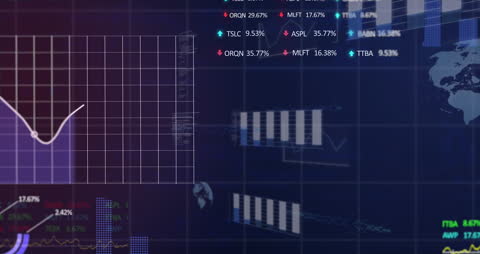
Dynamic holographic interface showcasing fluctuating stock market trends and trading figures layered with elements of computer code. Perfect for concepts related to financial technology, digital business analysis, and business globalization. This illustration can be ideal for tech company presentations, investment reports, and educational materials on financial technology.
Powered by 


downloads
Tags:
More
Credit Photo
If you would like to credit the Photo, here are some ways you can do so
Text Link
video Link
<span class="text-link">
<span>
<a target="_blank" href=https://pikwizard.com/video/animated-holographic-interface-with-stock-market-trends-and-coding-visuals/9ced15d80d338cbcc2f61ba0f52bb988/>PikWizard</a>
</span>
</span>
<span class="image-link">
<span
style="margin: 0 0 20px 0; display: inline-block; vertical-align: middle; width: 100%;"
>
<a
target="_blank"
href="https://pikwizard.com/video/animated-holographic-interface-with-stock-market-trends-and-coding-visuals/9ced15d80d338cbcc2f61ba0f52bb988/"
style="text-decoration: none; font-size: 10px; margin: 0;"
>
<video controls style="width: 100%; margin: 0;">
<source src="https://player.vimeo.com/progressive_redirect/playback/865838858/rendition/240p/file.mp4?loc=external&oauth2_token_id=1223210874&signature=37c0103725ffd95236745248020048db3e4c30e49153bf6f315d09a89bab90e9" type="video/mp4"
poster="https://pikwizard.com/pw/medium/9ced15d80d338cbcc2f61ba0f52bb988.jpg"/>
Your browser does not support the video tag.
</video>
<p style="font-size: 12px; margin: 0;">PikWizard</p>
</a>
</span>
</span>
Free (free of charge)
Free for personal and commercial use.
Author: Awesome Content