
- Home >
- Stock Videos >
- Data Visualization with Overlaying Fruit and Graphs
Data Visualization with Overlaying Fruit and Graphs Video
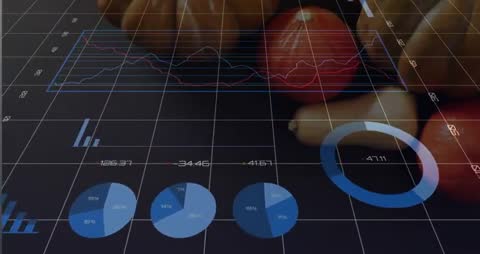
This video shows a unique blend of fresh fruits overlaid with various graphical charts such as pie charts, line graphs, and bar graphs, illustrating a visual integration of natural products and analytics. It can be used in presentations, reports, or digital dashboards where the intersection of agricultural trends and statistical data is being explored. Its visual appeal and informative layering make it a powerful tool for storytelling in sectors like agribusiness, market research, and analytics teams.
Powered by  - Get 15% off with code: PIKWIZARD15


2
downloads
downloads
Tags:
More
Credit Photo
If you would like to credit the Photo, here are some ways you can do so
Text Link
video Link
<span class="text-link">
<span>
<a target="_blank" href=https://pikwizard.com/video/data-visualization-with-overlaying-fruit-and-graphs/64f8618da624046cabe356032e64de2f/>PikWizard</a>
</span>
</span>
<span class="image-link">
<span
style="margin: 0 0 20px 0; display: inline-block; vertical-align: middle; width: 100%;"
>
<a
target="_blank"
href="https://pikwizard.com/video/data-visualization-with-overlaying-fruit-and-graphs/64f8618da624046cabe356032e64de2f/"
style="text-decoration: none; font-size: 10px; margin: 0;"
>
<video controls style="width: 100%; margin: 0;">
<source src="https://player.vimeo.com/progressive_redirect/playback/1098918549/rendition/240p/file.mp4?loc=external&oauth2_token_id=1223210874&signature=02fd2266a413ee5997eb8ef2a422d3ce1ec2ff9159af00d9125b840d98ea2c96" type="video/mp4"
poster="https://pikwizard.com/pw/medium/64f8618da624046cabe356032e64de2f.jpg"/>
Your browser does not support the video tag.
</video>
<p style="font-size: 12px; margin: 0;">PikWizard</p>
</a>
</span>
</span>
Free (free of charge)
Free for personal and commercial use.
Author: Awesome Content