
- Home >
- Stock Videos >
- Dynamic Financial Data Analysis Animation with Graphs
Dynamic Financial Data Analysis Animation with Graphs Video
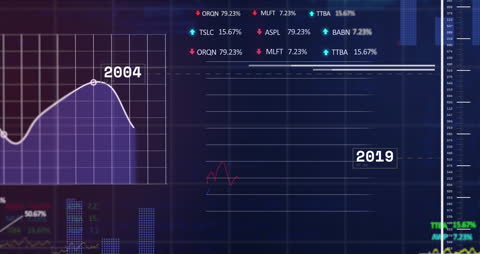
Visual represents digital animation of financial data analysis, including charts and graphs from 2004 to 2019. Useful for presentations on global finance trends, economic forecasts, and data science in fintech. Ideal for educational videos on investment, stock markets, and economic growth tracking.

downloads
Tags:
More
Credit Photo
If you would like to credit the Photo, here are some ways you can do so
Text Link
video Link
<span class="text-link">
<span>
<a target="_blank" href=https://pikwizard.com/video/dynamic-financial-data-analysis-animation-with-graphs/a4728ca000f6caf3aa19dfd467fb93f8/>PikWizard</a>
</span>
</span>
<span class="image-link">
<span
style="margin: 0 0 20px 0; display: inline-block; vertical-align: middle; width: 100%;"
>
<a
target="_blank"
href="https://pikwizard.com/video/dynamic-financial-data-analysis-animation-with-graphs/a4728ca000f6caf3aa19dfd467fb93f8/"
style="text-decoration: none; font-size: 10px; margin: 0;"
>
<video controls style="width: 100%; margin: 0;">
<source src="https://player.vimeo.com/progressive_redirect/playback/788498858/rendition/240p/file.mp4?loc=external&oauth2_token_id=1223210874&signature=23fef1b4e5c41b5e983ff98257491b575533faf9cf1794baf4b0f4a9c795a39b" type="video/mp4"
poster="https://pikwizard.com/pw/medium/a4728ca000f6caf3aa19dfd467fb93f8.jpg"/>
Your browser does not support the video tag.
</video>
<p style="font-size: 12px; margin: 0;">PikWizard</p>
</a>
</span>
</span>
Free (free of charge)
Free for personal and commercial use.
Author: Awesome Content