
- Home >
- Stock Videos >
- Dynamic Financial Data on Digital Trading Board Display
Dynamic Financial Data on Digital Trading Board Display Video
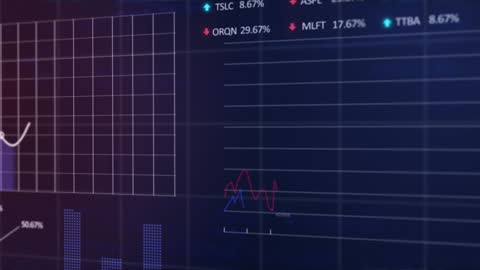
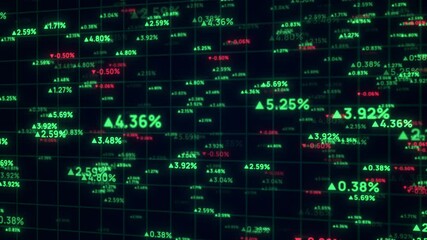
Illustrates financial data and stock market analysis on digital trading display utilising dynamic charts and graphs showing progress and changes. Suitable for illustrating concepts related to stock market trends, digital trading, financial reports, and investment strategies in presentations, articles, or financial websites.
Powered by 


7
downloads
downloads
Tags:
More
Credit Photo
If you would like to credit the Photo, here are some ways you can do so
Text Link
video Link
<span class="text-link">
<span>
<a target="_blank" href=https://pikwizard.com/video/dynamic-financial-data-on-digital-trading-board-display/2c6018d5a1b21c0513a6a50af38a242c/>PikWizard</a>
</span>
</span>
<span class="image-link">
<span
style="margin: 0 0 20px 0; display: inline-block; vertical-align: middle; width: 100%;"
>
<a
target="_blank"
href="https://pikwizard.com/video/dynamic-financial-data-on-digital-trading-board-display/2c6018d5a1b21c0513a6a50af38a242c/"
style="text-decoration: none; font-size: 10px; margin: 0;"
>
<video controls style="width: 100%; margin: 0;">
<source src="https://player.vimeo.com/progressive_redirect/playback/772234171/rendition/240p/file.mp4?loc=external&oauth2_token_id=1223210874&signature=95004f380d441c3225596d53c06d4d464e42c175fa3cbdc43ec823977fa31be0" type="video/mp4"
poster="https://pikwizard.com/pw/medium/2c6018d5a1b21c0513a6a50af38a242c.jpg"/>
Your browser does not support the video tag.
</video>
<p style="font-size: 12px; margin: 0;">PikWizard</p>
</a>
</span>
</span>
Free (free of charge)
Free for personal and commercial use.
Author: Awesome Content
Similar Free Stock Videos
Loading...