
- Home >
- Stock Videos >
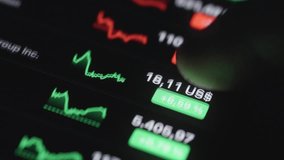
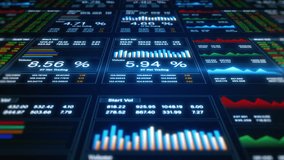
- Stock Market Graphs and Tickers in Digital Display Interface
Stock Market Graphs and Tickers in Digital Display Interface Video
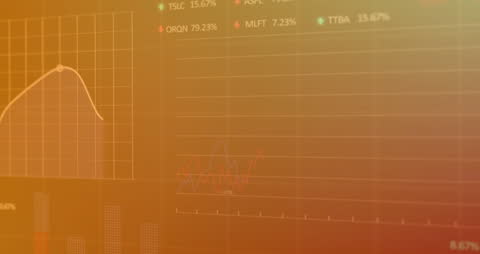
Displays dynamic nature of financial markets using various colored graphs and tickers on a digital screen. Ideal for illustrating concepts related to finance, investments, and global economic trends. Useful in presentations, articles on market analytics, or educational media about digital finance technology and interfaces.
Powered by  - Get 15% off with code: PIKWIZARD15


1
downloads
downloads
Tags:
More
Credit Photo
If you would like to credit the Photo, here are some ways you can do so
Text Link
video Link
<span class="text-link">
<span>
<a target="_blank" href=https://pikwizard.com/video/stock-market-graphs-and-tickers-in-digital-display-interface/f7db3edcbe164868304e889a11c3c5bd/>PikWizard</a>
</span>
</span>
<span class="image-link">
<span
style="margin: 0 0 20px 0; display: inline-block; vertical-align: middle; width: 100%;"
>
<a
target="_blank"
href="https://pikwizard.com/video/stock-market-graphs-and-tickers-in-digital-display-interface/f7db3edcbe164868304e889a11c3c5bd/"
style="text-decoration: none; font-size: 10px; margin: 0;"
>
<video controls style="width: 100%; margin: 0;">
<source src="https://player.vimeo.com/progressive_redirect/playback/828224777/rendition/240p/file.mp4?loc=external&oauth2_token_id=1223210874&signature=045830c3210031b9e05f7bbd6a436950d9289e9fe153b1892fe46a81bc370ac6" type="video/mp4"
poster="https://pikwizard.com/pw/medium/f7db3edcbe164868304e889a11c3c5bd.jpg"/>
Your browser does not support the video tag.
</video>
<p style="font-size: 12px; margin: 0;">PikWizard</p>
</a>
</span>
</span>
Free (free of charge)
Free for personal and commercial use.
Author: Awesome Content