
- Home >
- Free Stock Videos >
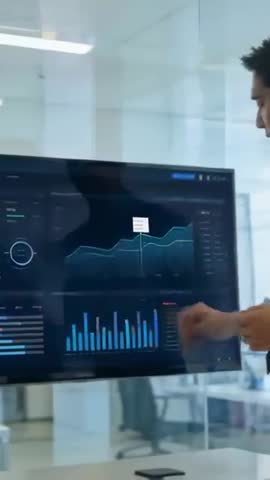
- Vertical corporate video featuring man touching screen and explaining analytics dashboard
Vertical corporate video featuring man touching screen and explaining analytics dashboard Free Stock Video
AI
AI Generated Video. Vertical clip showing man in light shirt touching large touchscreen display while explaining analytics dashboard. Animated line and bar charts presenting performance metrics, KPI trends, revenue growth and comparative analysis. Modern glass office background creating professional high-tech atmosphere; smartphone on table adding contextual detail and authenticity. Generous copy space around screen for text overlay, logo placement, captions or call-to-action. Suiting corporate presentations, investor updates, executive summaries, fintech demos, sales pitches, training modules and product marketing videos. Optimizing for mobile-first platforms and vertical formats such as Instagram Reels, TikTok, LinkedIn Stories and in-app ads. Including overlaying lower-third titles, animated callouts highlighting data points, voiceover narration and branded transitions. Using color palette of cool blues and dark UI elements reinforcing themes of technology, data analytics and business intelligence. Fitting stock footage libraries, website hero sections, social media campaigns, corporate reports and pitch deck background clips. Allowing editors to trim for 5-30 second social clips or integrate into longer presentations.
Powered by  - Get 15% off with code: PIKWIZARD15


downloads
Tags:
More
Credit Photo
If you would like to credit the Photo, here are some ways you can do so
Text Link
video Link
<span class="text-link">
<span>
<a target="_blank" href=https://pikwizard.com/video/vertical-corporate-video-featuring-man-touching-screen-and-explaining-analytics-dashboard/7c639dcb531128f789b8d5ea4d8e05e6/>PikWizard</a>
</span>
</span>
<span class="image-link">
<span
style="margin: 0 0 20px 0; display: inline-block; vertical-align: middle; width: 100%;"
>
<a
target="_blank"
href="https://pikwizard.com/video/vertical-corporate-video-featuring-man-touching-screen-and-explaining-analytics-dashboard/7c639dcb531128f789b8d5ea4d8e05e6/"
style="text-decoration: none; font-size: 10px; margin: 0;"
>
<video controls style="width: 100%; margin: 0;">
<source src="https://player.vimeo.com/progressive_redirect/playback/1193693098/rendition/240p/file.mp4%20%28240p%29.mp4?loc=external&oauth2_token_id=1223210874&signature=e83293bd959619456c328fc4147920472196600b587f6e10cfcfd00862a24d12" type="video/mp4"
poster="https://thumbs.wbm.im/pw/medium/7c639dcb531128f789b8d5ea4d8e05e6.jpg"/>
Your browser does not support the video tag.
</video>
<p style="font-size: 12px; margin: 0;">PikWizard</p>
</a>
</span>
</span>
Free (free of charge)
Free for personal and commercial use.
Author: AI Creator