
- Home >
- Stock Videos >
- Visual Representation of Financial Graphs and Charts
Visual Representation of Financial Graphs and Charts Video
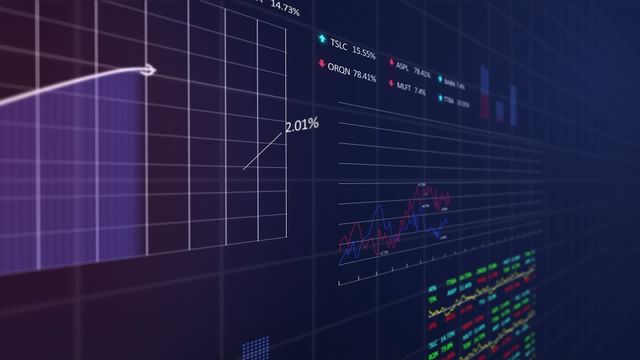
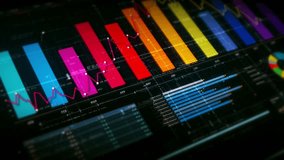
Abstract depiction of financial data displayed in graphs with upward trend lines. Concepts of data analysis support business decisions and strategic planning. Ideal for use in financial reports, presentations, and business strategy articles to illustrate bearish or bullish market trends and economic forecasts.
Powered by  - Get 15% off with code: PIKWIZARD15


0
downloads
downloads
Tags:
More
Credit Photo
If you would like to credit the Photo, here are some ways you can do so
Text Link
video Link
<span class="text-link">
<span>
<a target="_blank" href=https://pikwizard.com/video/visual-representation-of-financial-graphs-and-charts/722831e26248781767706799289ed7f1/>PikWizard</a>
</span>
</span>
<span class="image-link">
<span
style="margin: 0 0 20px 0; display: inline-block; vertical-align: middle; width: 100%;"
>
<a
target="_blank"
href="https://pikwizard.com/video/visual-representation-of-financial-graphs-and-charts/722831e26248781767706799289ed7f1/"
style="text-decoration: none; font-size: 10px; margin: 0;"
>
<video controls style="width: 100%; margin: 0;">
<source src="https://player.vimeo.com/progressive_redirect/playback/851535935/rendition/240p/file.mp4?loc=external&oauth2_token_id=1223210874&signature=8569ebad861d677a11eb7ab5547a8b15f5563d5b24c1e23202f6b86c420e282d" type="video/mp4"
poster="https://pikwizard.com/pw/medium/722831e26248781767706799289ed7f1.jpg"/>
Your browser does not support the video tag.
</video>
<p style="font-size: 12px; margin: 0;">PikWizard</p>
</a>
</span>
</span>
Free (free of charge)
Free for personal and commercial use.
Author: Awesome Content