- Home >
- Stock Photos >
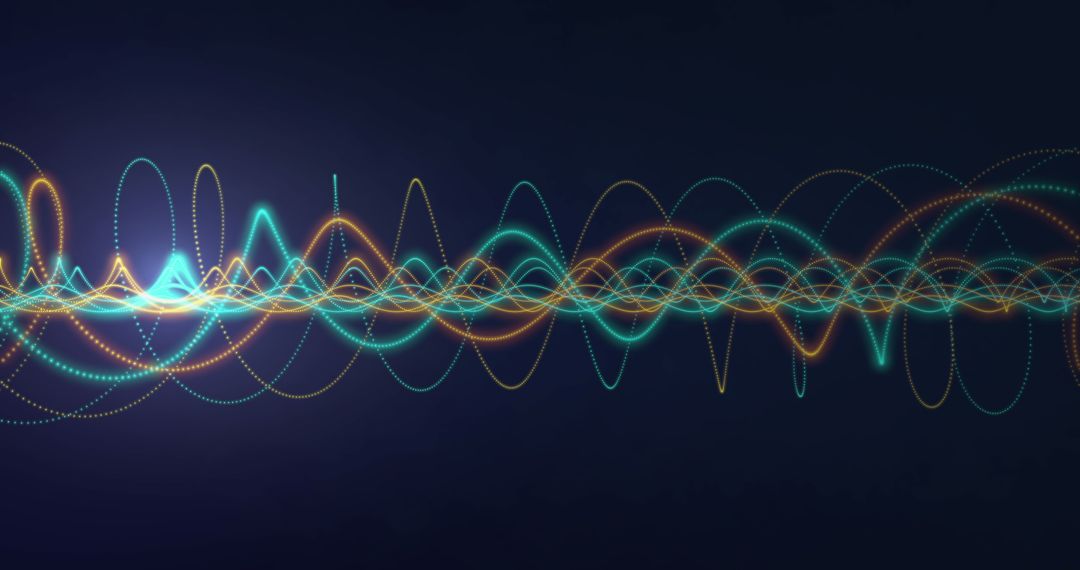
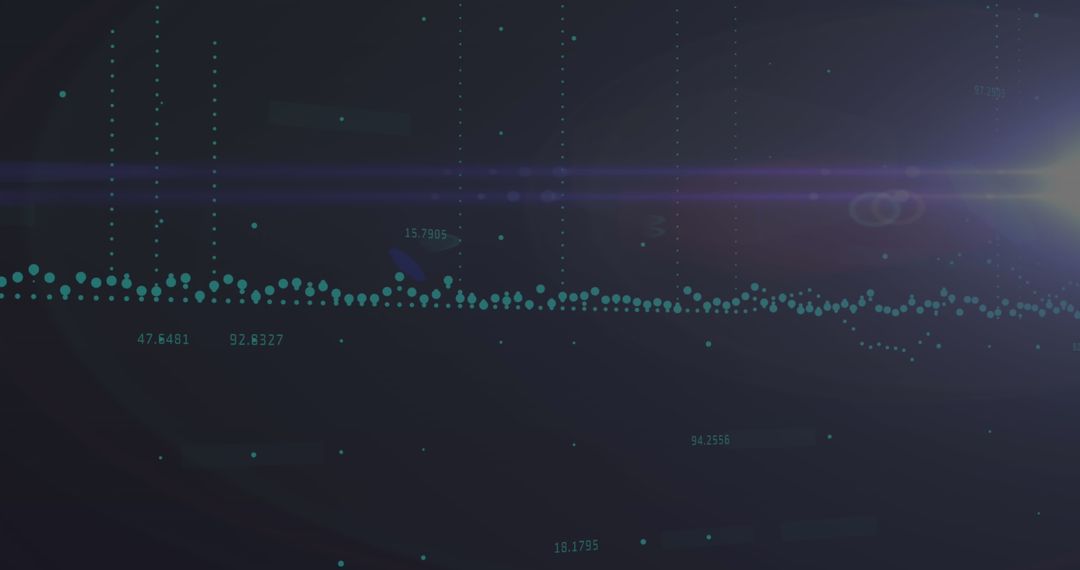
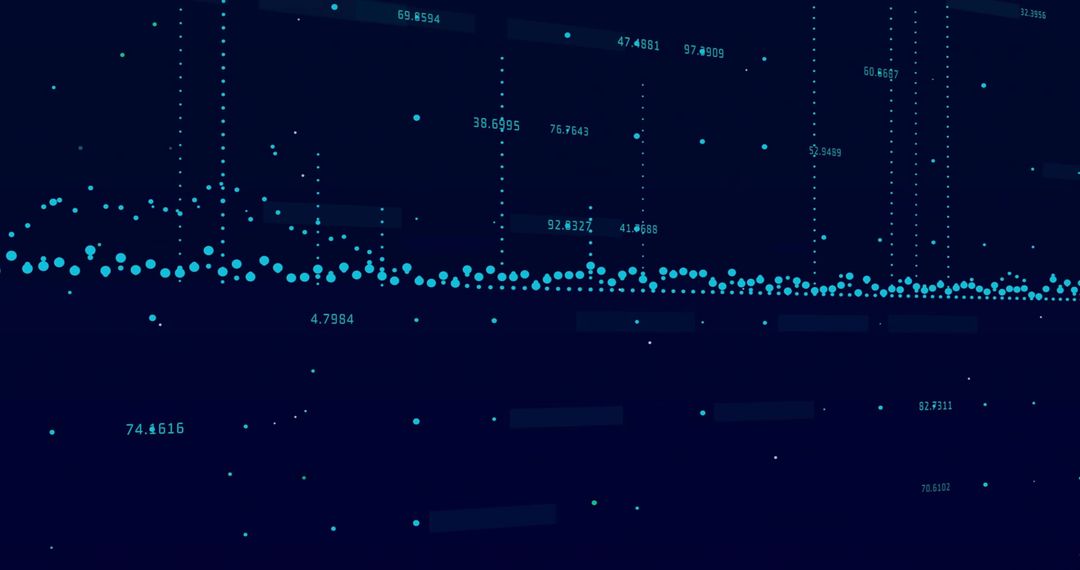
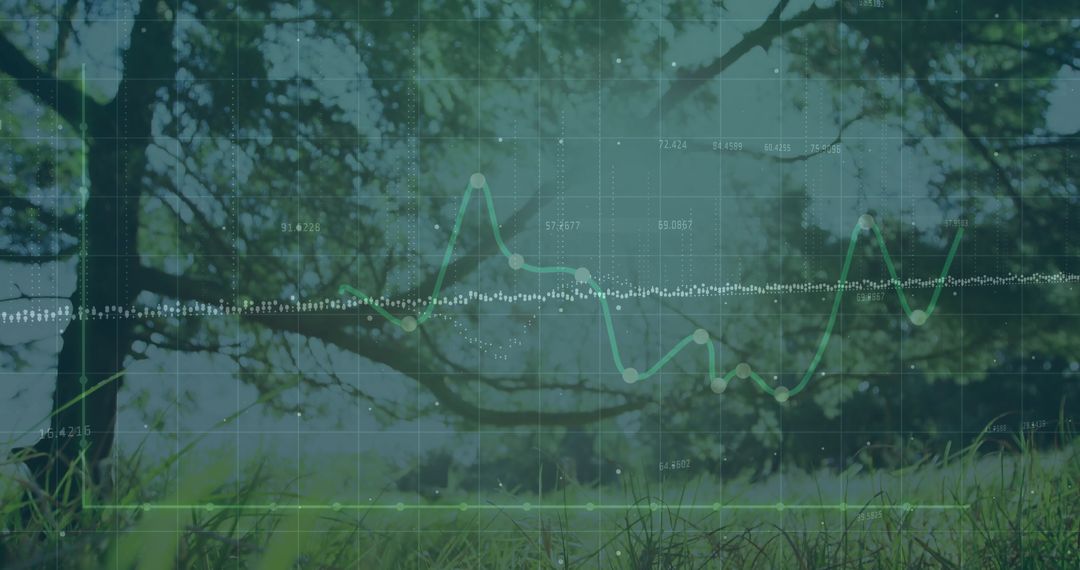
- Pulsing dotted waveform across futuristic analytics dashboard neon teal purple gradient
Pulsing dotted waveform across futuristic analytics dashboard neon teal purple gradient Image

Showing pulsing dotted waveform across dark teal and purple gradient with vertical numeric markers and floating data points. Conveying futuristic analytics, signal processing, and real-time monitoring mood. Working well for website hero banners, presentation slides, investor pitch decks, fintech reports, AI and machine learning articles, dashboard UI mockups, technology event posters, music visualizers, and podcast covers. Providing strong linear focal point for overlaying headlines, charts, logos, or callouts. Offering high contrast and cinematic feel for modern tech branding and editorial uses.
Powered by  - Get 15% off with code: PIKWIZARD15


0
downloads
downloads
Tags:
More
Credit Photo
If you would like to credit the Photo, here are some ways you can do so
Text Link
photo Link
<span class="text-link">
<span>
<a target="_blank" href=https://pikwizard.com/photo/pulsing-dotted-waveform-across-futuristic-analytics-dashboard-neon-teal-purple-gradient/b20b986f9095cb791e4a07e4d91b607d/>PikWizard</a>
</span>
</span>
<span class="image-link">
<span
style="margin: 0 0 20px 0; display: inline-block; vertical-align: middle; width: 100%;"
>
<a
target="_blank"
href="https://pikwizard.com/photo/pulsing-dotted-waveform-across-futuristic-analytics-dashboard-neon-teal-purple-gradient/b20b986f9095cb791e4a07e4d91b607d/"
style="text-decoration: none; font-size: 10px; margin: 0;"
>
<img src="https://pikwizard.com/pw/medium/b20b986f9095cb791e4a07e4d91b607d.jpg" style="margin: 0; width: 100%;" alt="" />
<p style="font-size: 12px; margin: 0;">PikWizard</p>
</a>
</span>
</span>
Free (free of charge)
Free for personal and commercial use.
Author: Creative Art
Similar Free Stock Images

Premium


Premium


Premium


Premium


Premium


Premium


Premium


Premium


Premium


Premium


Premium


Premium


Premium


Premium


Premium


Premium


Premium


Premium


Premium


Premium


Premium


Premium


Premium


Premium